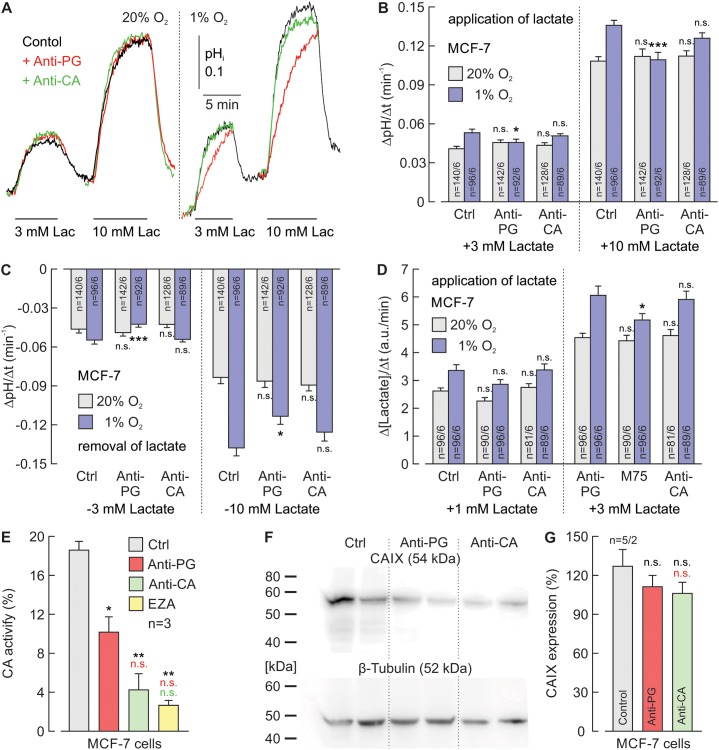
Figure 5. Antibodies directed against the PG domain, but not against the catalytic domain of CAIX reduce lactate transport in hypoxic MCF-7 cells.
(A) Original recordings of the change in intracellular pH (pHi) during application of 3 and 10 mM of lactate in MCF-7 breast cancer cells, incubated under normoxia (left traces) or hypoxia (right traces), in the presence of 5 μg/ml Anti-PG (red traces), 5 μg/ml Anti-CA (green traces) or in the absence of antibodies (black traces). (B, C) Rate of change in intracellular pH, as induced by application (B) and removal (C) of lactate in MCF-7 cells, incubated under normoxia (gray) or hypoxia (blue), in the presence of Anti-PG, Anti-CA or in the absence of antibodies (Ctrl). (D) Relative change in intracellular lactate concentration, as induced by application of lactate in MCF-7 cells, incubated under normoxia (gray) or hypoxia (blue) in the presence of Anti-PG, Anti-CA or in the absence of antibodies (Ctrl). Data are represented as mean ± SEM. Significance in differences was tested with ANOVA, followed by means comparison. The significance indicators above the bars from cells, incubated with antibody refer to the corresponding values from control cells (Ctrl). (E) CA catalytic activity of MCF-7 cells, as measured by gas-analysis mass spectrometry, in the presence 5 μg/ml Anti-PG (red), 5 μg/ml Anti-CA (green), 30 μM of the CA inhibitor EZA (yellow) and in the absence of antibodies or inhibitors (Ctrl). Data are represented as mean + SEM. Significance in differences was tested with ANOVA, followed by means comparison. The black asterisks above the bars from cells treated with antibodies or EZA refer to the values from control cells (gray bar). The red asterisks above the bars from cells treated with Anti-CA or EZA refer to the values from cells treated with Anti-PG (red bar). The green significance indicator above the bar from cells treated with EZA refers to the values from cells treated with Anti-CA (green bar). (F) Western blot against CAIX and β-tubulin as loading control, in MCF-7 cells, incubated in the presence Anti-PG, Anti-CA or in the absence of antibodies (Ctrl). (G) Quantification of the protein level of CAIX in MCF-7 cells, incubated in the presence Anti-PG (red), Anti-CA (green) or in the absence of antibodies (gray) relative to the protein level of β-tubulin. Data are represented as mean + SEM. Significance in differences was tested with ANOVA, followed by means comparison. The black significance indicators above the bars from cells, incubated with antibody refer to the corresponding values from control cells (gray bar). The red significance indicator above the bar from cells treated with Anti-CA refers to the values from cells treated with Anti-PG (red bar).

