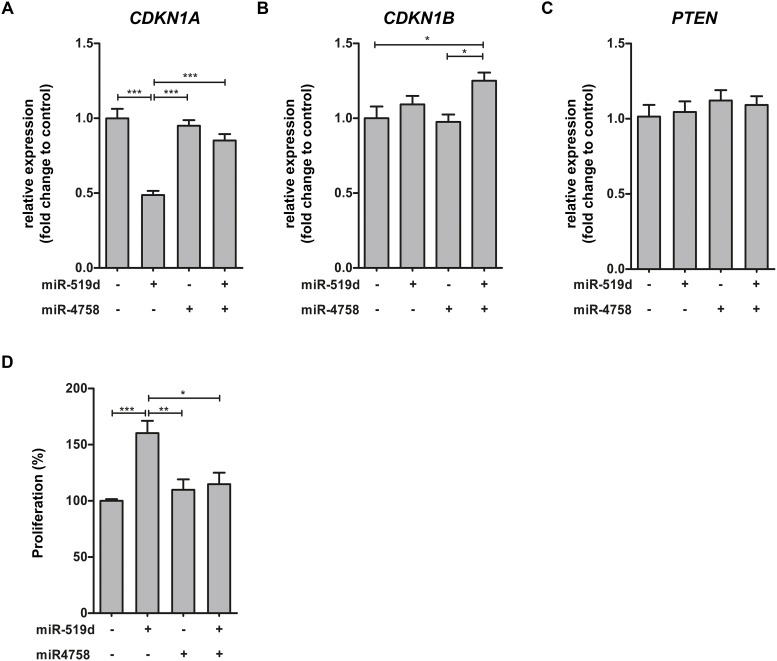
Figure 4. miR-519d and miR-4758 target mRNA expression and the regulation of cell cycle in cell culture.
Panels (A-C): Relative expression of CDKN1A (A), CDKN1B (B) and PTEN (C) after transfection of LGG2 cell line for 24 hours with lipofectamine (n=5), miR-519d mimic (n=4), miR-4758 mimic (n=5) or miR-519d mimic co-transfected with miR-4758 mimic (n=5). Panel (D): The S phase of cell cycle progression after transfection with lipofectamine (n=7), miR-519d (n=7), miR-4758 (n=8) and miR-519d (n=7) co-transfected with miR-4758 in LGG2. miR-519d transfected LGG2 cells displayed an increased S phase compared to the negative control. miR-4758 transfected cultures displayed no alteration in S phase. Co-transfection of miR-519d and miR-4758 was able to mimic the response of the negative control. The error bars represent SEM; statistical significance: *p < 0.05; **p < 0.01, ***p < 0.001, Kruskal-Wallis test followed by Mann-Whitney U test.

