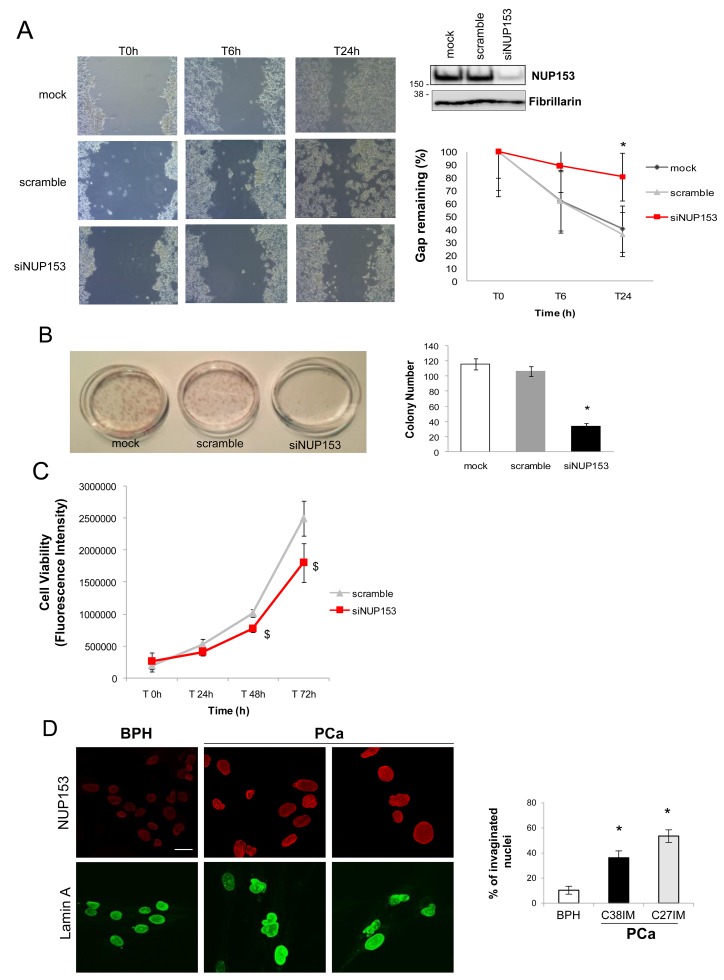
Figure 1. Nup153 depletion in PCa cells regulates migration and colony formation.
(A) Representative phase contrast images (Bright field) of a scratch test in a time course of 24h (left panel) and its quantification (right panel, down), expressed as percentage of remaining gap, in Nup153 silenced (siNUP153 oligos mix; 60nM), scramble control and mock transfected LNCaP cells. The wound was made 48h after transfection. Nup153 protein level in the above conditions is shown in the western blot (right panel, up). (B) Left panel: Representative digital image showing colonies produced by PCa (C27IM) cells after plating 150 cells. Cells were transfected in the same experimental conditions of scratch test and, after eight days, were fixed and stained with hematoxilin. In the right panel, the number of colonies for each condition is shown. Data expressed as mean +/-SEM of 3 independent experiments. * p< 0.05 vs mock. (C) Cell Viability in a time course of 72h in the same experimental conditions as described for scratch test. Data are expressed as mean +/-SEM of 3 independent experiments in triplicate, corrected to fluorescence background. $ p< 0.05 vs scramble. (D) Confocal analysis of PCa (C27IM and C38IM) and Benign Prostatic Hyperplasia (BPH, C17IM) cells stained with antibodies to Nup153 ([QE5]; red) or Lamin A (green). Scale bar: 20 μm (Nup153 and Lamin A). The graph shows the percentage of nuclei bearing invaginations (right panel). * p< 0.05 vs BPH.

