
Figure 2.
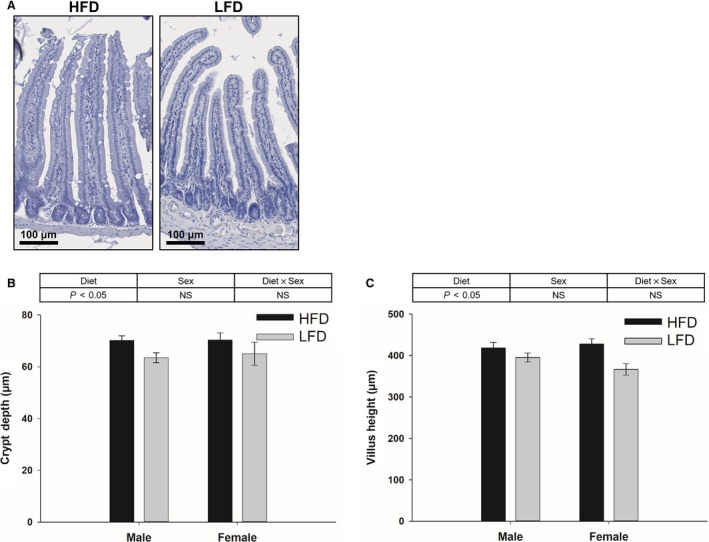
Representative image of hematoxylin stained crypt‐villus morphology (A) and quantification of crypt depth (B) and villus height (C) in the jejunum collected from mice fed with HFD or LFD using diet and sex as two factors (two‐way ANOVA). Data are expressed as Mean ± SEM (n = 6–10). Scale bar, 100 μm.