
Figure 6.
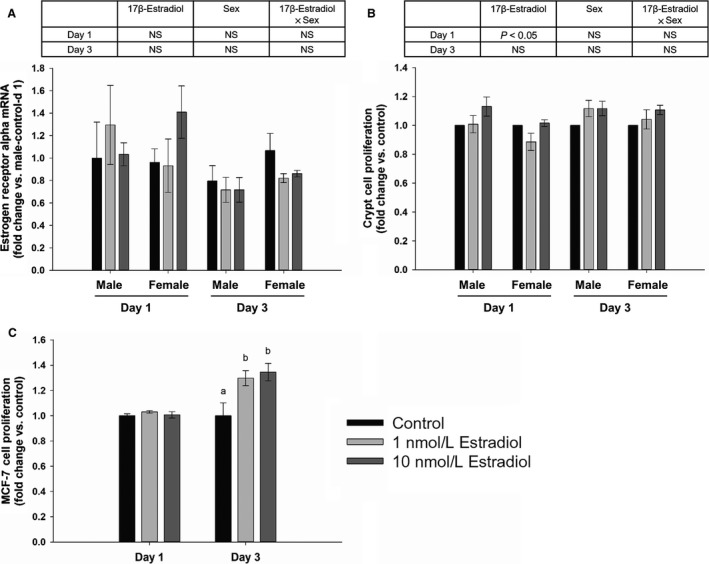
ER α expression (A) and cell proliferation (B) in response to 17β‐estradiol using 17β‐estradiol and sex as two factors (two‐way ANOVA; n = 3), and the proliferation of MCF‐7 cells (positive control) (one‐way ANOVA; n = 4) (C). Data are expressed as Mean ± SEM of fold changes. Means with different letters indicate significantly different at each time point, P < 0.05.