Fig. 2.
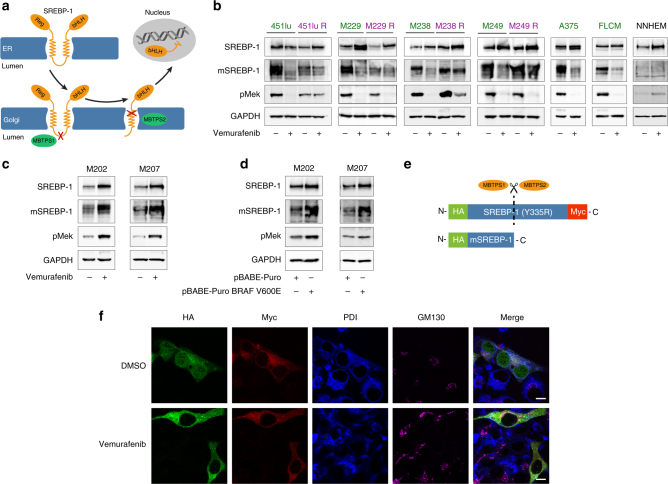
Effects of vemurafenib on lipid metabolism involves SREBP-1. a Diagram illustrating the processing of SREBP: through SCAP interaction, SREBP is transported from the ER to the Golgi where it is consecutively cleaved by two proteases, yielding transcriptionally active, mature SREBP (mSREBP). b–d Western analysis of SREBP-1 (full-length and mature) and pMEK (Ser217/221). GAPDH is used as a loading control. b Western blot analysis for mSREBP levels in response to vemurafenib treatment in sensitive and resistant cells. c Western blot analysis of BRAF wild-type (but NRAS mutant) melanoma cells M202 and M207 treated with vemurafenib (5 μM). d Western blot analysis of BRAF wild-type, NRAS mutant melanoma cells, 72 h after transfection with pBABE-Puro BRAFV600E. e Diagram illustrating the HA-SREBP-1(Y335R)-myc construct. The Y335R mutation renders the construct transcriptionally inactive. f Confocal analysis of 451lu cells expressing HA-SREBP-1(Y335R)-myc. A PDI antibody was used to mark the ER and GM130 was used for cis-Golgi. Scale bar indicates 25 μM

