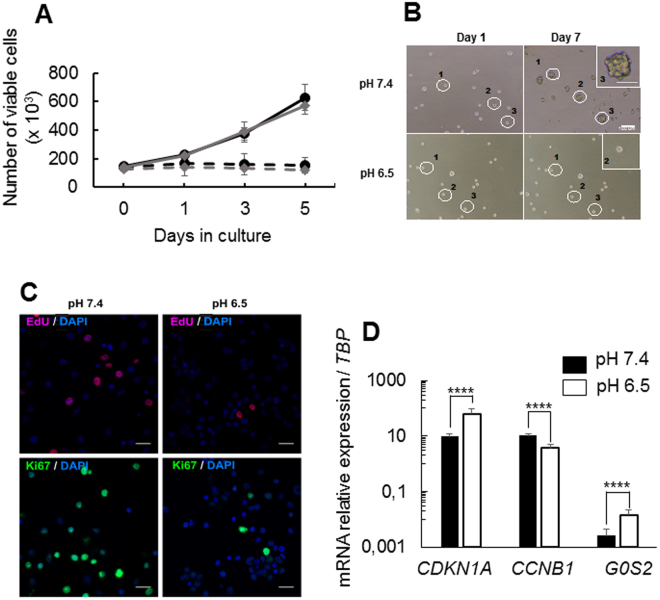
Figure 1.
In vitro induction of quiescence in GSLCs. (A) Cell proliferation measured by counting the number of viable cells over 5 days in NS34 medium at pH 7.4 for TG1 and TG1_C1 cells (black and grey lines respectively) and in NS34 at pH 6.5 for TG1 and TG1_C1 cells (dotted black and gray lines respectively). Each measure was done in triplicates and with 3 independent experiments. (B) TG1 cells were plated in semi-solid agar medium at pH 7.5 or pH 6.5 to assess their ability to form secondary spheres. Shown are the same fields taken at Day 1 and Day 7 in the 2 culture conditions. Only single cells culture at pH 7.4 (white circles) are able to proliferate and to form a secondary spheres (Inset). (C) EdU incorporation (upper panels) and Ki67 positive cells (lower panels) at pH 7.4 and pH 6.5 for TG1 cells. (D) Expression of CDKN1A, CCNB1 and G0S2 in TG1 cells in NS34 at pH7.4 compared to TG1 cells in NS34 at pH 6.5, was assessed by QRT-PCR after 5 days of culture. Results are given relative to TBP (TATA-Box Binding Protein) expression level. Error bars are derived from 11 independent experiments. Pictures were taken with a 20X 0.40 N.A. objective on Nikon eclipse TS100 microscope. Scale bars: 100 µm in B and 50 µm in Inset, 10 µm in C.

