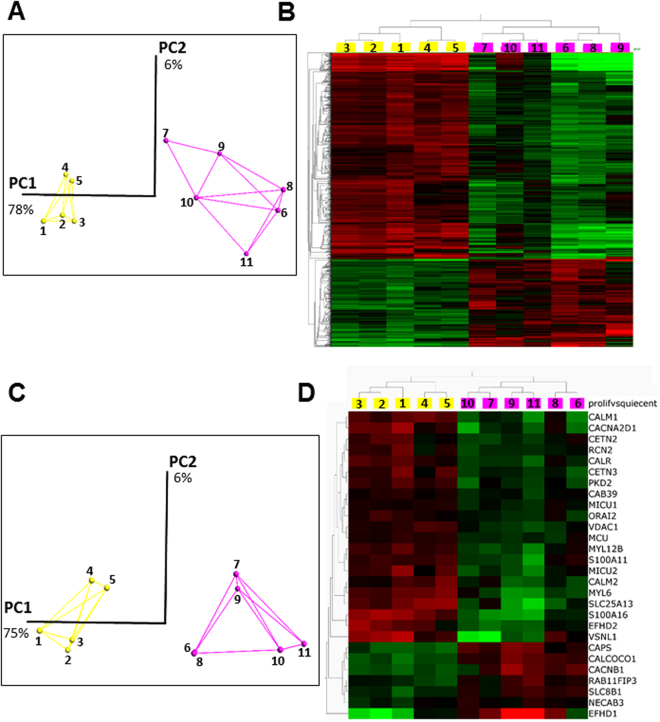
Figure 2.
RNA signatures of proliferative and quiescent GSLCs. RNAS-seq data were analyzed using Qlucore software as described under materials and methods. We used a q-value of 5% to retain 1419 genes differentially expressed between proliferative and quiescent TG1 and TG1-C1 cells (see supplemental materials for the list of the 1419 genes). Yellow color is used for proliferative cells and pink color for quiescent cells. (A) Three-dimensional representation of principal component analyses for the 1419 genes significantly and differentially expressed between the proliferative and the quiescent GSLCs (for culture conditions see below and Table S1). The two principal components represent 78% and 9% of the information respectively. (B) Heat-map of differential gene expression for the 1419 selected genes. Each column represents the different experimental conditions (see below and table S1) and each lines represents a single gene. Expression levels are colored green for low intensities and red for high intensities. (C) Three-dimensional representation of principal component analyses for the 28 genes of the Ca2+ toolbox significantly and differentially expressed between the proliferative and the quiescent GSLCs. The link between experiments illustrates a proximity. The two main components represent 79% and 8% of the information, respectively. (D) Heat-map using the same set of 28 genes analyzed in Fig. 2C. Culture conditions are as followed: For proliferative conditions; Experiments #1–3, TG1 cells in NS34 medium at pH 7.4; Experiments # 4–5, TG1_C1 cells in NS34 medium at pH 7.4. For quiescent conditions; Experiments #6–7; no replacement of NS34 medium during 9 days for TG1 and TG1_C1 cells respectively; Experiments #8–9, NS34 pH 6.2 during 5 days for TG1 and TG1_C1 cells respectively; Experiment #10, NS34 pH 6.5 during 5 days for TG1 cells and Experiment #11, SKF96365 (10 µM) in NS34 pH 7.4 for TG1 cells.

