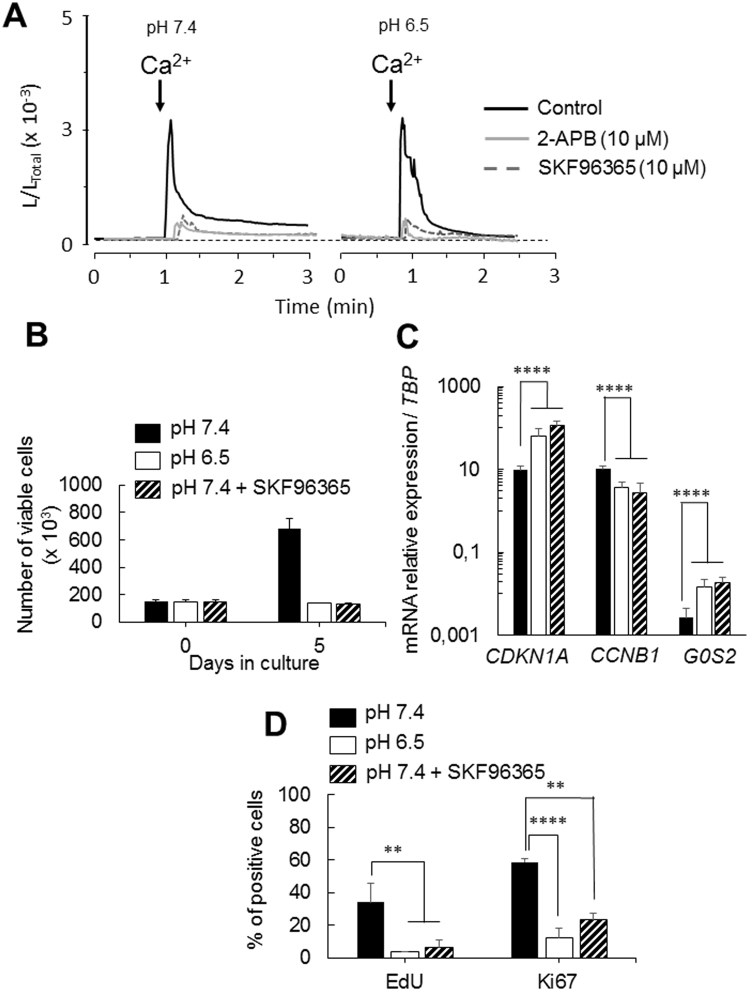
Figure 3.
Remodeling of SOCE activity between proliferative and quiescent GSLCs. (A) Representative photo-multiplier (PMT) traces obtained from CytGA expressing TG1 cells in proliferating (left panel, pH 7.4) or in quiescent (right panel, pH 6.5) conditions (black traces) or in presence of 10 µM of inhibitors of SOC channels; SKF96365 (dotted traces) or 2-APB (grey traces). Values are plotted as L/LTOTAL and every trace is the mean of 3 independent experiments. Prior to recording cells were washed with Ca2+-free medium, the arrows indicate the time at which medium containing 1 mM Ca2+ is perfused. (B) Cell proliferation measured by counting the number of viable cells over 5 days in NS34 at pH 7.4 in absence (black bars) or presence of SKF96365 (10 µM) (striped bars) and in NS34 at pH 6.5 (open bars). Each measure was done in triplicates with 3 independent experiments. (C) Expression of CDKN1A, CCNB1 and G0S2 was assessed by QRT-PCR in TG1 cells after 5 days in NS34 at pH7.4 in absence (black bars) or presence of SKF96365 (10 µM) (striped bars) and in NS34 at pH 6.5 (open bars). Results are given relative to TBP (TATA-Box Binding Protein) expression level. Error bars are derived from 11 independent experiments. (D) Histogram plot of the percentage of EdU and Ki67 positive cells in NS34 at pH 7.4 in absence (black bars) or presence of SKF96365 (10 µM) (striped bars) and in NS34 at pH 6.5 (open bars), determined by analysis of 6 confocal microscopy fields. Error bars are derived from 3 independent experiments.

