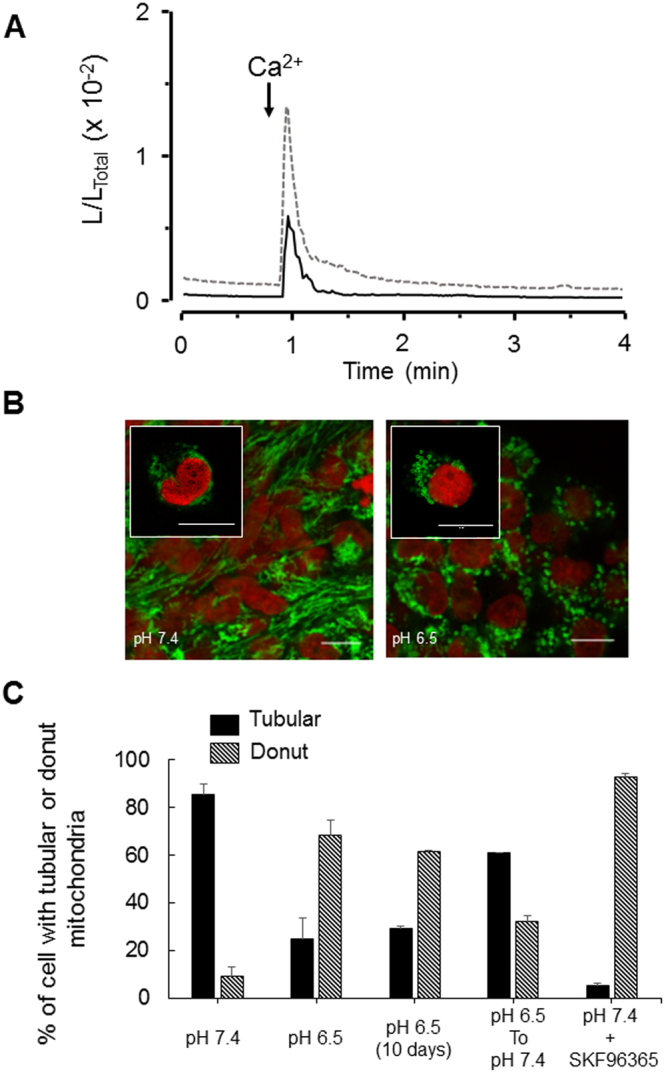
Figure 4.

Remodeling of mitochondrial Ca2+ uptake and mitochondrial shapes in proliferative and quiescent GSLCs. (A) Representative PMT traces obtained from MitGA expressing TG1 cells in proliferating (black line, pH 7.4) or in quiescent (dotted grey line, pH 6.5) conditions. Values are plotted as L/LTOTAL and every trace is the mean of 3 independent experiments. Prior to recording cells were washed with Ca2+-free medium, the arrows indicate the time at which medium containing 1 mM Ca2+ is perfused. (B) Confocal microscopy analysis of mitochondria shapes in proliferating (left panel, pH 7.4) and in quiescent TG1 cells (right panel, pH 6.5). Mitochondria were labeled with TOM20 antibody (green) and nucleus with Draq5 (red). Tubular mitochondria are found in proliferating TG1 cells (left panel and Inset) and donut-shaped mitochondria in quiescent TG1 cells (right panel and Inset). (C) Tubular (filled black bars) and donut-shaped mitochondria (striped black bars) quantified for the different culture conditions as indicated. Pictures were taken with a 63X 1.40 N.A. objective on a Leica SP8 upright confocal microscope. Scale bars: 10 µm in Insets; 5 µm for the other pictures.
