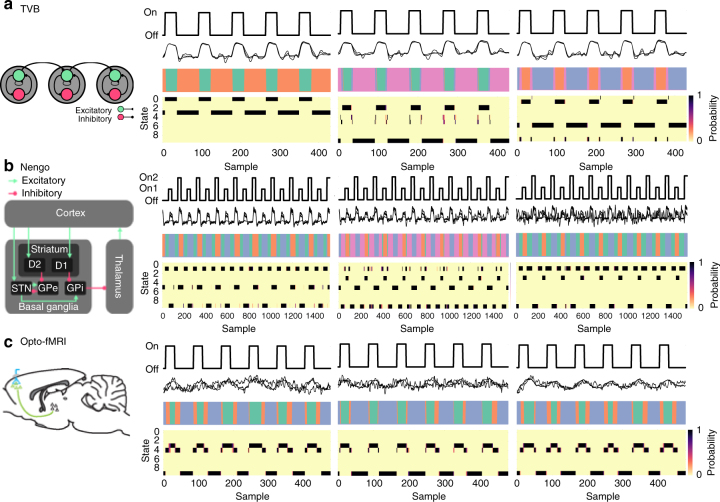
Fig. 2.
Illustration of dynamic brain states that were automatically estimated using BSDS. In both simulated and experimental opto-fMRI data, BSDS accurately and reliably identified distinct brain states across time. a Data simulated using neurophysiological realistic models implemented in The Virtual Brain (TVB); b Data simulated using a cortico-thalamic-basal ganglia model implemented in Neural Engineering Object (Nengo). In each simulation, three exemplar data (subjects) and results are presented in the three sub-panels from left to right. In each sub-panel, the top row illustrates task waveform (e.g., stimulation on and off states); the second row shows simulated time series; the third row shows the temporal evolution of each latent state; and the bottom row shows posterior probabilities of each states across time. Note that for a and b BSDS was applied in a subject-wise fashion. c Dynamic brain states determined from experimental opto-fMRI data acquired during in vivo optogenetic stimulation in three rodents. In addition to ON and OFF states, BSDS also identified a novel transition state associated with switching between the ON and OFF states. Here, BSDS was applied in a group-wise fashion. The rodent brain diagram in the left column is adapted from a previous study39

