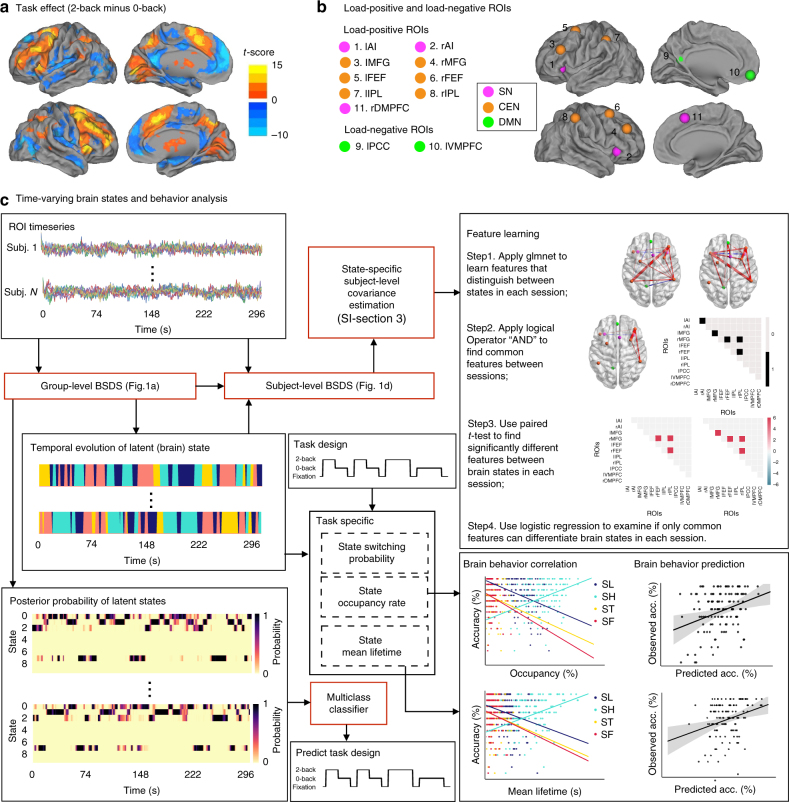
Fig. 3.
Application of BSDS to human WM data from the Human Connectome Project. a Brain regions activated (warm colors) and deactivated (cool colors) during the 2-back, compared to the 0-back, task condition. b Regions of interest (ROIs) were determined using activation and deactivation peaks from a. ROIs activated during WM predominantly overlapped with the Salience Network (SN) and Central Executive Network (CEN): 1, left anterior insula (lAI); 2, right anterior insula (rAI); 3, left middle frontal gyrus (lMFG); 4, right middle frontal gyrus (rMFG); 5, left frontal eye field (lFEF); 6, right frontal eye field (rFEF); 7, left intraparietal lobule (lIPL); 8, right intraparietal lobule (rIPL); and 11, right dosomedial prefrontal cortex (rDMPFC). ROIs deactivated during WM mainly overlapped with the Default Mode Network (DMN): 9, left posterior cingulate cortex (lPCC) and 10, left ventromedial prefrontal cortex (lVMPFC). c Schematic illustration of time series analysis. We first applied group-level BSDS on the ROI time series. We then performed the following post-analyses. In the first part of the analysis, we used the group-level estimated temporal evolution of states together with the group-level learnt model parameters as the input for subject-level BSDS analysis for estimation of subject-specific and state-specific covariance matrices. A feature learning procedure was then used to discriminate latent states based on dynamic network features, computed from covariance matrices. In the second part of the analysis, we first extracted dynamic state properties: occupancy rate, mean lifetime, and transition probabilities of states from the estimated temporal evolution of states. We then performed brain behavior analysis using these dynamic state properties. In the third part of the analysis, we used a multiclass classifier trained on the estimated posterior probability of latent states to predict task waveform

