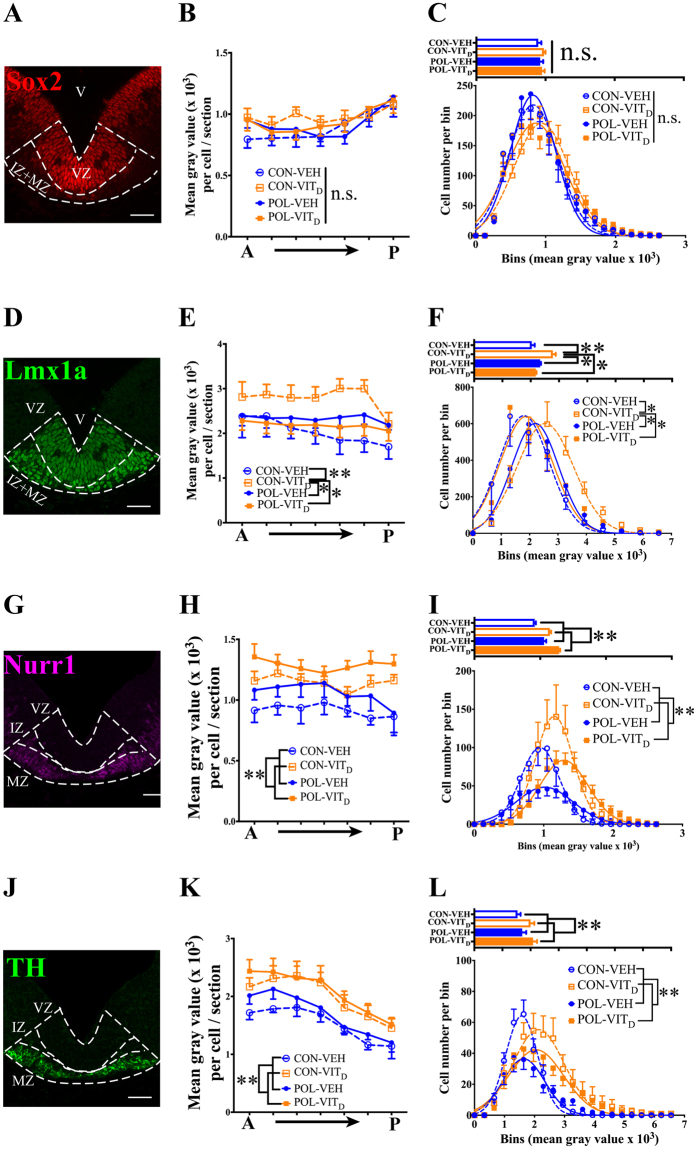
Figure 4.
The effects of single and combined MIA and VITD treatment on the expression of factors important in the development of mesDA neurons. (A) A representative floor plate (FP) of coronal MES section showing mesDA cells expressing Sox2 (red). (B) Neither MIA or VITD treatment altered the mean intensity of Sox2 in mesDA progenitors (Lmx1a+Sox2+) (p’s > 0.05). (C) Bar plots represent the average fluorescence of Sox2 in mesDA progenitors among treatment groups. Distribution analysis representing a nonlinear regression to predict the Gaussian distribution of mesDA progenitor number relative to the intensity of Sox2 expression. (D) A representative FP of coronal MES section showing post-mitotic mesDA cells expressing Lmx1a (green). (E) VITD treatment significantly increased the mean intensity of Lmx1a in mesDAs compared with other treatment groups (p’s < 0.05). (F) Bar plots represent the average expression of Lmx1a among treatment groups. Distribution analysis showed VITD treatment itself increased the number of cells expressing higher levels of Lmx1a compared to other treatment groups (p’s < 0.05). (G) A representative FP of coronal MES section showing post-mitotic mesDA cells expressing Nurr1 (magenta). (H) VITD treatment significantly increased the expression of Nurr1 in post-mitotic (Nurr1+) mesDAs (p < 0.05). (I) Bar plots represent the average fluorescence of Nurr1 among treatment groups. Distribution analysis showed VITD treatment increased the number of cells expressing higher levels of Nurr1 compared to VEH (p < 0.05). (J) A representative FP of coronal MES section showing mature mesDAs expressing TH (green). (K) VITD treatment increased the average fluorescence of TH in mature (Nurr1+TH+) mesDAs. (L) Bar plots represent the average TH mean intensity in mature mesDAs among treatment groups. The distribution analysis verified that VITD treatment increased the number of mature (Nurr1+TH+) mesDAs that expressed higher levels of TH compared to VEH (p < 0.01). All values were means ± SEM. *p < 0.05, **p < 0.01. Scale bars: 50 µm.

