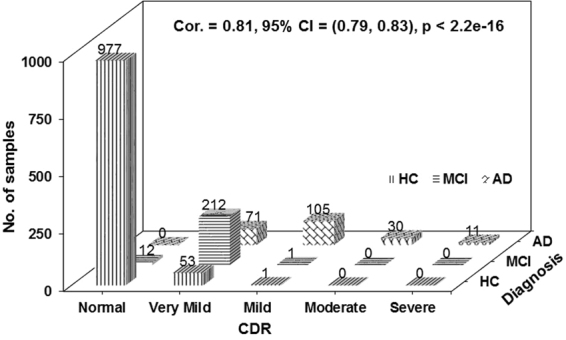
Figure 2.

Strong correlation between clinical diagnosis and Clinical Dementia Rating (CDR) categories. Vertical bars: healthy control (HC); horizontal bars: MCI; diagonal brick bars: AD; Cor.: correlation coefficient; CI: confidence interval. CDR scores reflect 5 categories: normal controls (CDR = 0), very mild (CDR = 0.5), mild (CDR = 1), moderate (CDR = 2), and severe (CDR = 3) patients. Clinical diagnosis contains 3 categories: HC, MCI, and AD. The data distribution along with the Cor., 95% CI, and p-value showed a significant correlation between clinical diagnosis and CDR.
