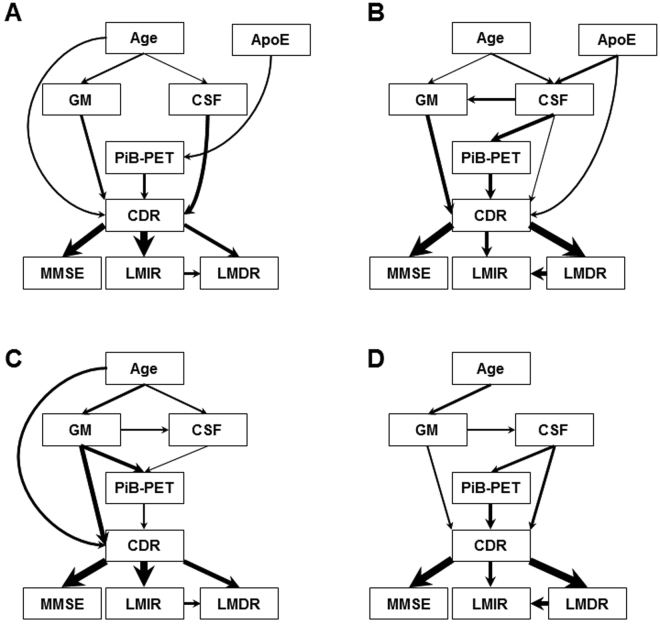
Figure 4.
Bayesian networks based on the complete data at different times. (A) Group 1 data at BL (197 participants). (B) Group 1 data, assessments conducted at least once during the M18-54 time interval (130 participants). (C) Group 2 longitudinal data at BL (133 participants) including time-evolved features. (D) Group 2 longitudinal data, assessments conducted at least once during the M18-54 time interval including time-evolved features. The thickness of arrows represents the strength of the probabilistic influences between variables. As the Group 2 set uses longitudinal data focuses, the ApoE feature was disregarded due to its unchanging nature.

