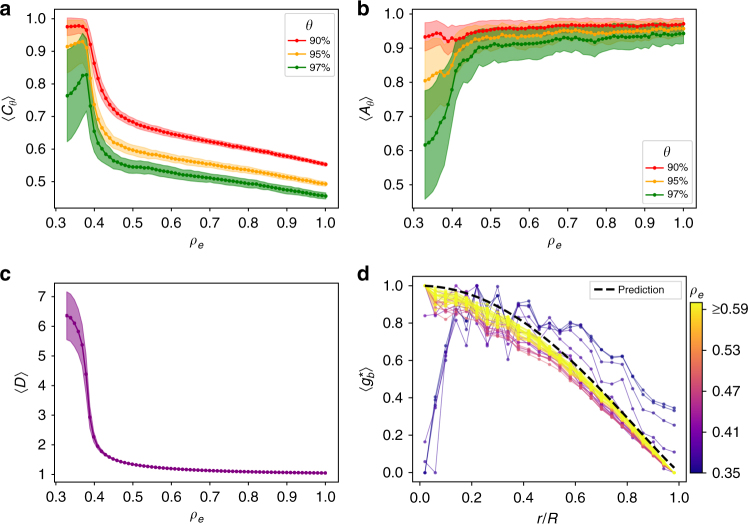
Fig. 4.
Quantifying the spatial effect of edge-density ρe on high betweenness nodes a The metric 〈Cθ〉 (Eq. (9)) decreases for denser networks, capturing the tendency of the nodes to be increasingly clustered around their center of mass. b Correspondingly they also become more isotropic around this center as Aθ (Eq. (11)) approaches 1. c The network also becomes increasingly geometric as indicated by the decrease in the average detour factor 〈D〉 (Eq. (12)) measured for the full network, which experiences an abrupt transition around ρe∼0.4. The shaded regions represent fluctuations over hundred realizations of the randomization procedure. d The average BC for nodes at a distance r from the barycenter (rescaled to the interval [0,1]), measured in units of r/R where R = 50 is the grid boundary. Curves are colored according to the value of ρe. The dashed line corresponds to the analytical calculation for an infinitely dense random geometric graph55. The metrics are computed for the networks generated in Fig. 3. (here indicates averaging over realizations)

