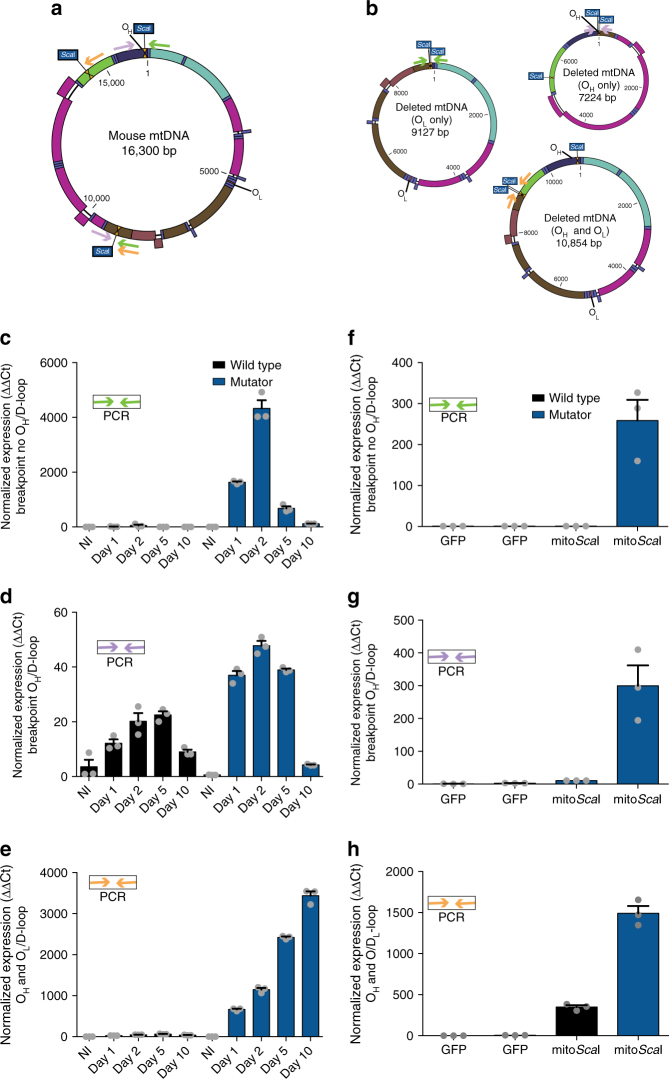
Fig. 4.
Quantification of mtDNA rearrangements after DSB in the mutator mouse. a Diagram of wild-type C57BL6/J mtDNA illustrating the location and number of ScaI sites and primers used to quantify rearrangements following ScaI infection. Green primers amplify rearrangements that do not contain the origin of replication of the heavy-strand (OH), purple primers amplify rearrangements that contain the OH, orange primers amplify rearrangements that contain the OH and the OL. b Diagrams of putative C57BL6/J partially-deleted mtDNA after Ad-mitoScaI-HA infection and primers used to quantify rearrangements. One deleted molecule does not contain the OH (green primers) whereas the other deleted molecule contains the OH (purple primers). The last deleted molecule contains both the OH and the OL (orange primers). Quantification of the breakpoint without OH in (c) mutator and wild-type fibroblasts at 1, 2, 5, and 10 days and (f) mutator and wild-type liver at 5 days after Ad-mitoScaI infection. Levels of the breakpoint without OH were normalized to a region in the D-loop. Quantification of the breakpoint with OH in (d) mutator and wild-type fibroblasts at 1, 2, 5, and 10 days and (g) mutator and wild-type liver at 5 days after Ad-mitoScaI-HA infection. Levels of the breakpoint with OH were normalized to a region in the D-loop. Quantification of the breakpoint with OH and OL in (e) mutator and wild-type fibroblasts at 1, 2, 5, and 10 days and (h) mutator and wild-type liver at 5 days after Ad-mitoScaI-HA infection. Levels of the breakpoint with OH and OL were normalized to a region in the D-loop. NI indicates not infected. Quantification was performed using comparative ΔΔCt method. Error bars (s.e.m.) derive from technical replicates

