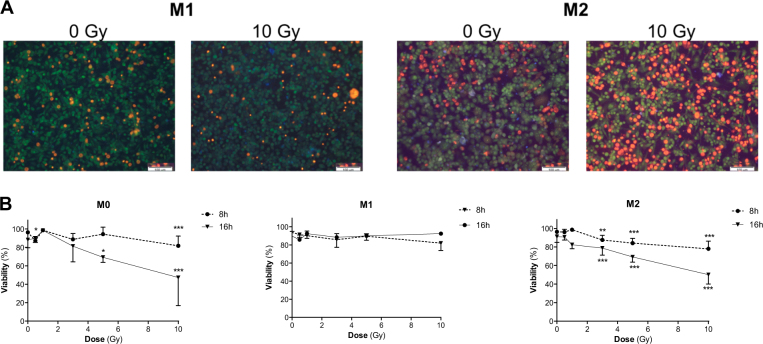
Fig. 2. Early radioresistance of M1 macrophages after moderate doses of proton irradiation.
M0, M1, and M2 macrophages were irradiated with different doses of protons. Viability was assessed by ethidium bromide−acridin orange at different times postirradiation. a Representative ethidium bromide−acridine orange staining images of M1 and M2 macrophages 16 h after proton irradiation (0 Gy and 10 Gy). Lived cells appeared in green while dead cells are stained in orange. b Quantification of viability (%) in M0, M1, and M2 macrophages, 8 or 16 h after proton irradiation. N = 3 for each dose (mean ± SD). One-way ANOVA analyses followed by Dunnett’s multiple comparisons post-tests were performed on data; *p ≤ 0.05; **p < 0.01; ***p < 0.001

