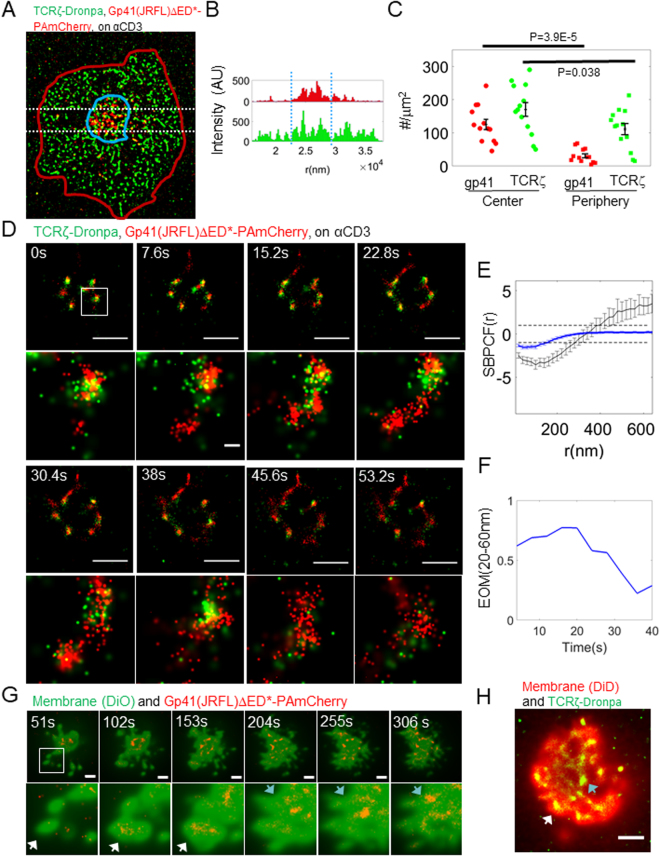
Figure 2.
Gp41 and TCR are recruited together to the centre of the IS through early forming contacts and separate with cell spreading. (A) Gp41(JRFL)ΔED*-PAmCherry-enriched region at the centre (blue line) of the activated cells (red line) was manually identified. (A) Representative cell is shown (N = 12). (B) The distribution of molecular content of the shown cell in a horizontal cross section (white dotted lines in A). Blue dotted lines mark the horizontal edges of the central region in A. (C) The molecular content of these central regions was then compared to the surrounding areas (see also Table S1). (D) Two-colour PALM imaging of a live Jurkat E6.1 cell expressing TCRζ-Dronpa and gp41(JRFL)ΔED*-PAmCherry on an αCD3-coated coverslips. Each of the images was collected from 100 frames at a frame rate of 13.1 fps, yielding an effective frame time of 7.6 s. Bars – 2 μm. (E) Standardized bivariate PCF of TCRζ-Dronpa and gp41-PAmCherry (blue), compared to the 95% confidence interval of a Random labelling model (RL; black dotted lines at 1 and −1) and a model of no interaction (NI; black solid line). The correlation was averaged over the images in D for the shown clusters in the zoom and for all time-points. (F) The extent of mixing of TCRζ-Dronpa and gp41-PAmCherry, calculated for each wide area image in D. Error bars are SEM. (G) Two-colour TIRF imaging of a live Jurkat E6.1 cell expressing gp41(JRFL)ΔED*-PAmCherry (imaged via PALM) and the membrane stain DiO on an αCD3-coated coverslip. Each of the images was collected from 500 frames at a frame rate of 9.8 fps, yielding an effective frame time of 51 s. White arrowheads mark gp41 clusters in early segregated contacts; Cyan arrowheads mark gp41 clusters in flat and continuous membrane patches. A representative cell is shown (N = 9). Bars – 2 μm. (H) Two-colour TIRF imaging of a live Jurkat E6.1 cell expressing TCRζ-Dronpa (imaged via PALM) and the membrane stain DiD on an αCD3-coated coverslip. White arrowheads mark TCR clusters in early segregated contacts; Cyan arrowheads mark TCR clusters in flat and continuous membrane patches. A representative cell is shown (N = 9). Bar – 2 μm.

