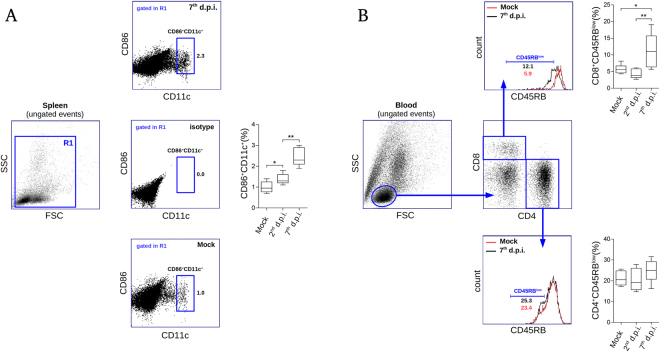
Figure 1.
Flow cytometry analysis of spleen and blood samples from DENV-infected mice. Groups of BALB/c mice (n = 6 each), mock, 2nd and 7th days post infection (d.p.i.) were considered for flow cytometry evaluation using individual spleen and blood samples. (A) Isolated splenocytes were stained with anti-CD86-FITC and anti-CD11c-PE and read into a BD Accuri C6 flow cytometer. Only events clustered into the R1 region in the forward and side light scattering representation (FSC × SSC) were took into account for this analysis (left). Based on the isotype control, a CD86+ CD11c+ region (considered as the antigen presenting cell subset) was defined (center). Representative flow cytometry dotplots regarding mock and infected samples, as well as the quantitative analysis between groups are shown (bottom, top, and right, respectively). (B) Flow cytometry analysis showing leukocytes isolated from blood stained with anti-CD8-PerCP, anti-CD4-PE and anti-CD45RB-FITC. A region of lymphocytes in the FSC × SSC representation was defined (left) for subsequent specification of CD4+ and CD8+ regions (center). Expression of CD45RB was investigated within the CD4+ and CD8+ regions considering non-infected and infected groups (bottom and top, respectively). Statistical analyses are shown for each evaluation (top right and bottom right). Statistical differences were evaluated using Mann-Whitney test (*p < 0.05; **p < 0.01).

