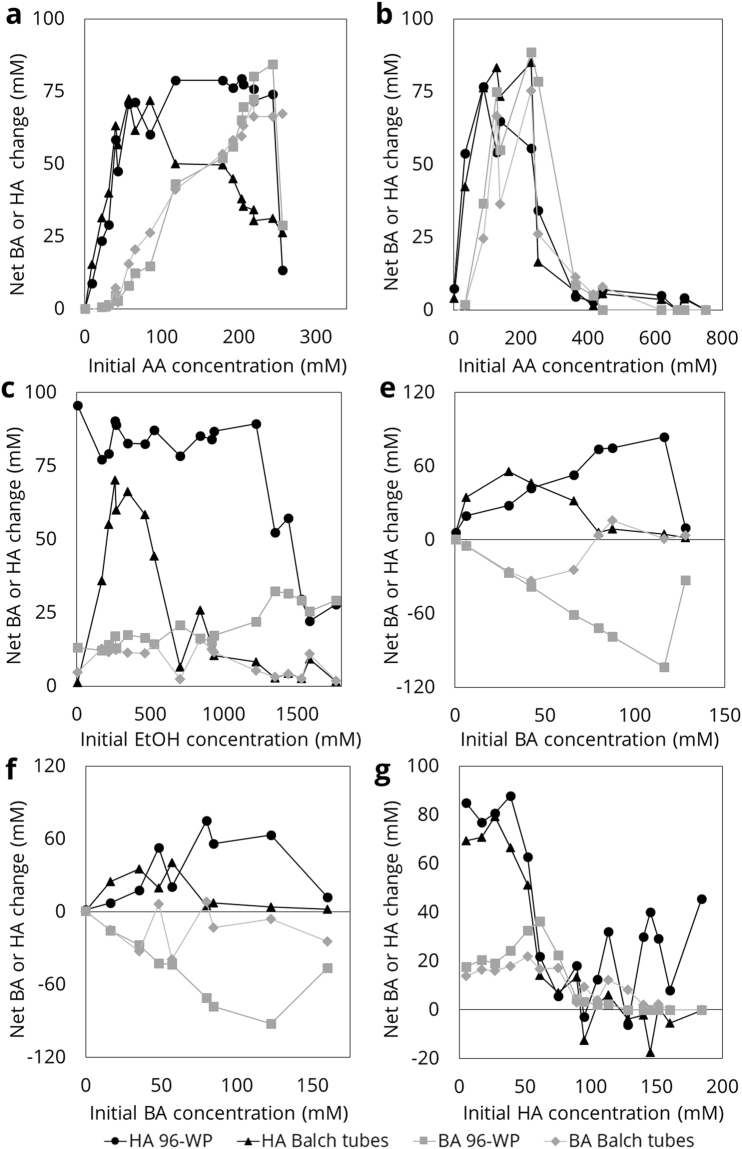
Figure 2.
Comparison of butyric acid (BA) and hexanoic acid (HA) production or consumption in Balch tubes vs. 96-WP at the end of all experiments (90–100 h). HA change in 96-well plates (96-WP) represented by black circles (●), BA in 96-WP by grey squares ( ). HA change in Balch tubes is represented by black triangles (▲), BA in Balch tubes by grey diamonds (
 ) at the end of each experiment. Label for each subfigure refers to experiment number (Table 1). Experiment D did not result in any observable growth due to a lack of acetic acid (AA) in the medium (Supplementary Information S.2.5.).

