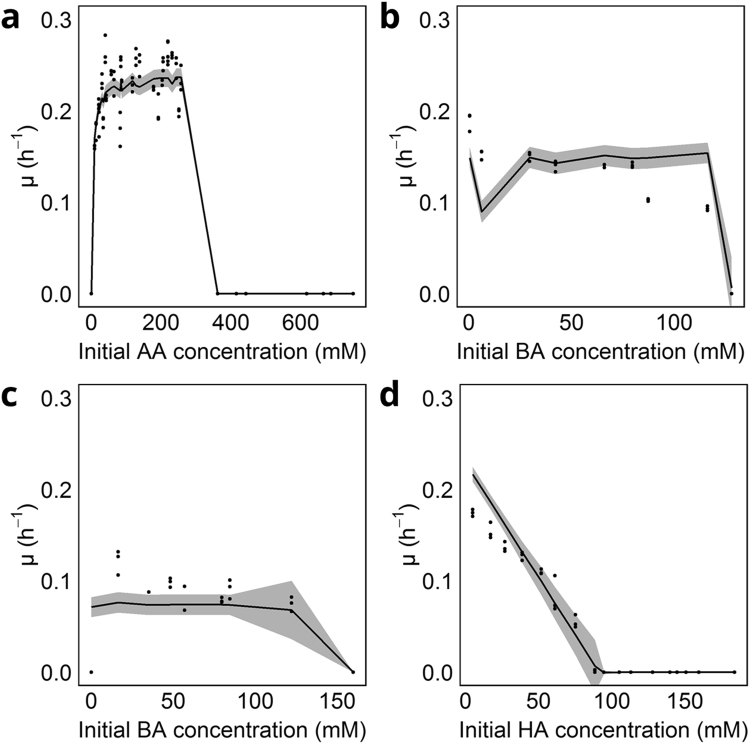
Figure 4.
Fit and uncertainty on kinetic model for C. kluyveri. In all figures, dots represent a single experiment, with all experiments performed in triplicate. Full lines represent model output, shaded area is the uncertainty of the model. 3 A shows the fit to varying AA between 0 and 750 mM at a fixed concentration of EtOH (343 mM) (experiments A and B; Table 1). 3B shows µ in function of varying BA concentrations at a fixed initial EtOH concentration (343 mM) and AA-concentration (6 mM) (Experiment E; Table 1); 3 C similar to 3B but at an initial AA-concentration of 1.6 mM (Experiment F; Table 1). Lastly, 3D shows fit to Experiment G, varying concentrations of HA at standard DSM52 conditions (in practice 80 mM AA, 343 mM EtOH).

