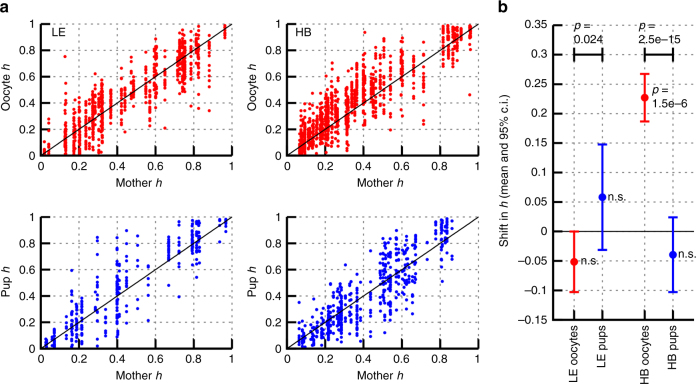
Fig. 3.
MtDNA heteroplasmy shift between mother and oocytes/offspring. a Heteroplasmy in mother reference tissue (x-axis) against the heteroplasmy values of their respective oocytes or pups (y-axis). Circles indicate individual measurements of single oocytes; or reference tissue biopsies of pups at day 21 post-partum. The diagonal line marks theoretical neutral segregation. b Summaries of heteroplasmy shifts relative to reference tissues. P-values associated with datapoints give the result of a Mann–Whitney test against the null hypothesis of both reference and subsequently measured heteroplasmies having the same mean. P-values associated with comparisons (top) give the result of a Mann–Whitney test against the null hypothesis that oocyte and pup heteroplasmies have the same mean. In the LE model, segregation is close to neutral in oocytes and pups: heteroplasmy values of both oocytes and pups average around that of their mothers, with the expected variation caused by the bottleneck. In the HB model, a clear increase of HB mtDNA is visible in the oocytes, which is reversed in offspring. The direction of shift from oocyte to pup is different in the two different mouse models: heteroplasmy increases in LE and decreases in HB. Oocytes: n = 795 LE; 1152 HB. Pups: n = 552 HB, 347 LE

