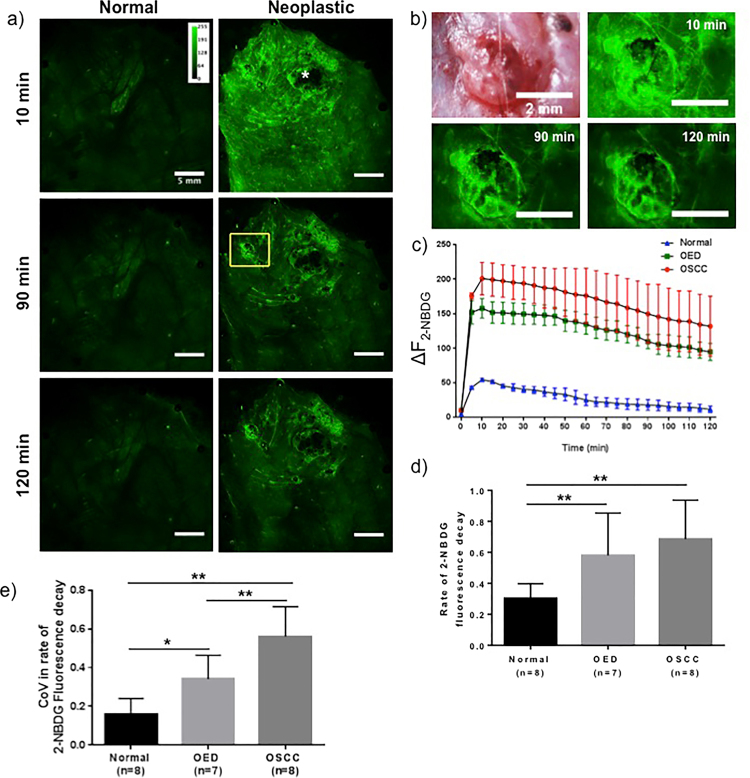
Figure 7.
Temporal assessment of 2-NBDG fluorescence decay. (a) 2-NBDG fluorescence intensity over a 2-hour time period after topical application on a normal and a DMBA-treated hamster cheek pouch mucosa. Only 10 min, 90 min and 120 min time points are shown for clarity; (b) white light image and post 2-NBDG images of a non-necrotic tumor from the ROI (yellow outline) shown in (a); (c) change in fluorescence intensity over time with a 5 minute interval for ROIs selected from normal, OED and OSCC. Error bars represent five samplings within each site; (d) rate of 2-NBDG fluorescence intensity decay measured as the slope between 10 min – 120 min; (e) average variance in slope for normal, OED and OSCC with five samplings within each site. P-value * < 0.05, ** < 0.01.

