
Fig. 2.
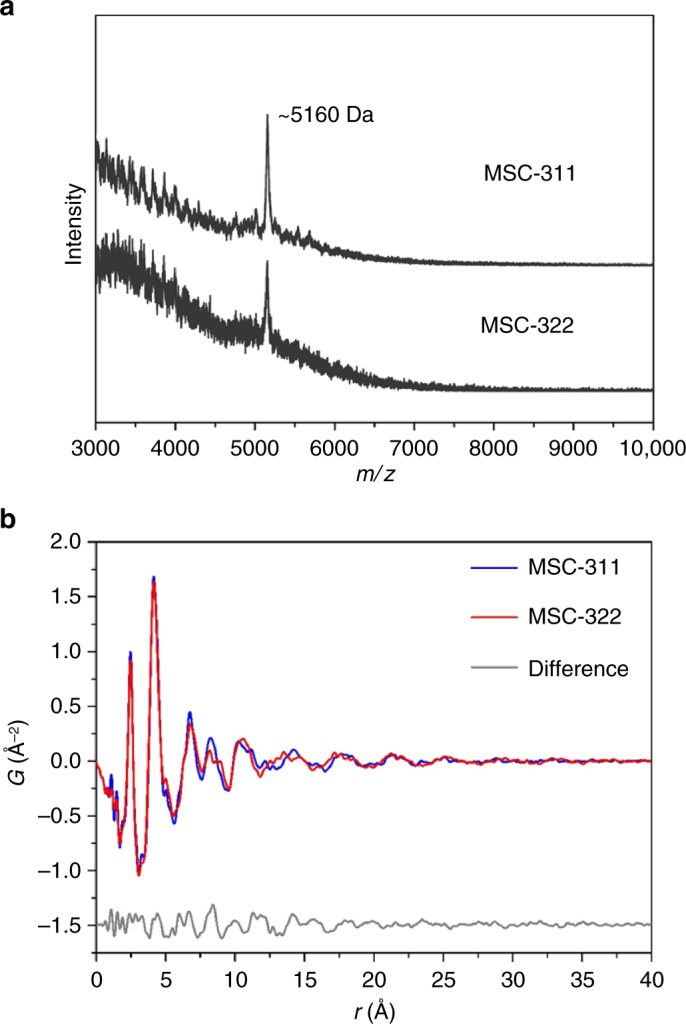
Mass and structural characterization of MSC-311 and MSC-322. a MALDI-TOF mass spectra of MSC-311 and MSC-322 with the m/z range from 3000 to 10,000 Da. The species at ~5160 Da were detected for both the clusters. b PDF analysis of MSC-311 (blue trace) and MSC-322 (red trace), together with their intensity difference (gray trace obtained by MSC-311 subtracting MSC-322 with offset). For both the clusters, the first two sharp peaks (at 2.46 and 4.15 Å) are similar, suggesting that the nearest-neighbor Cd–S, Cd–Cd, and S–S distances are similar. The sharp short-range structural correlations indicate intra-cluster distances up to 10–20 Å (beyond which there are no further sharp correlation peaks). Accordingly, the two clusters have similar sizes. Meanwhile, the difference between the two PDF patterns in the range of 5–17 Å (gray trace) provides evidence that the two clusters have different structures