Figure 5.
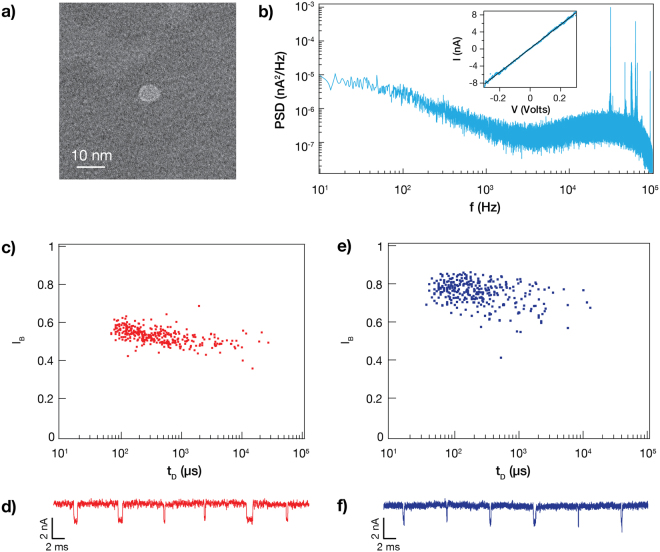
Noise and functionality of a laser-etched nanopore. (a) TEM image showing a nanopore with a diameter of 6.5 nm. Compared to the peripheral membrane, the nanopore is very bright, owing to an unobstructed electron beam path. (b) Power spectral density (PSD) plot of a nanopore for an applied bias of 300 mV. The inlet shows the corresponding current-voltage (IV) curve for this nanopore, with a linear fitting (R2 > 0.99). (c) Scatter plot of dsDNA translocation events. The trans chamber was biased to 300 mV to drive translocation of 300 pM 5054 bp dsDNA from cis to trans. The size of the pore is 3.1 ± 0.3 nm based on the current blockage level/molecular ruler model. (d) A concatenated ionic current trace showing sample dsDNA translocation events. (e) Scatter plot of di-ubiquitin (K63-linked di-Ub) translocation events at pH 7. The trans chamber was biased to 300 mV to drive translocation of 0.007 μg/µl di-Ub from cis to trans. (f) A concatenated ionic current trace showing sample di-Ub translocation events.

