Figure 1.

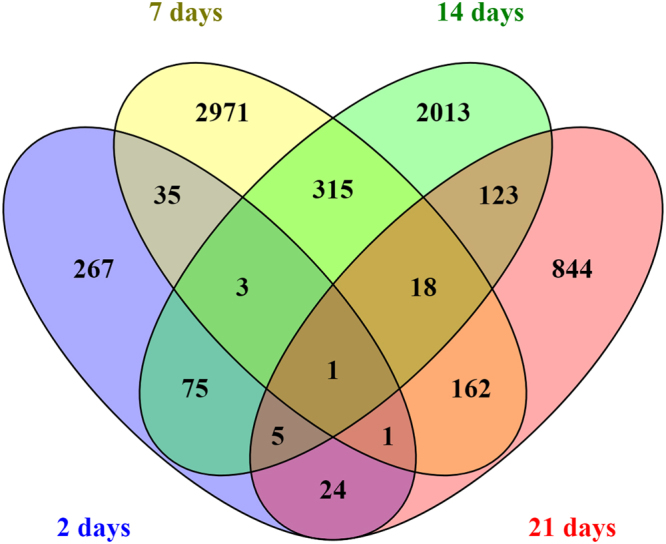
Venn diagram of the overlap (not based on directionality of expression) of DEGs (p < 0.05 and Log2FC > 1.5) at different time points (2, 7, 14, and 21 days) after exposure to E171 in colon of mice. Each colour represents a different day.

Venn diagram of the overlap (not based on directionality of expression) of DEGs (p < 0.05 and Log2FC > 1.5) at different time points (2, 7, 14, and 21 days) after exposure to E171 in colon of mice. Each colour represents a different day.