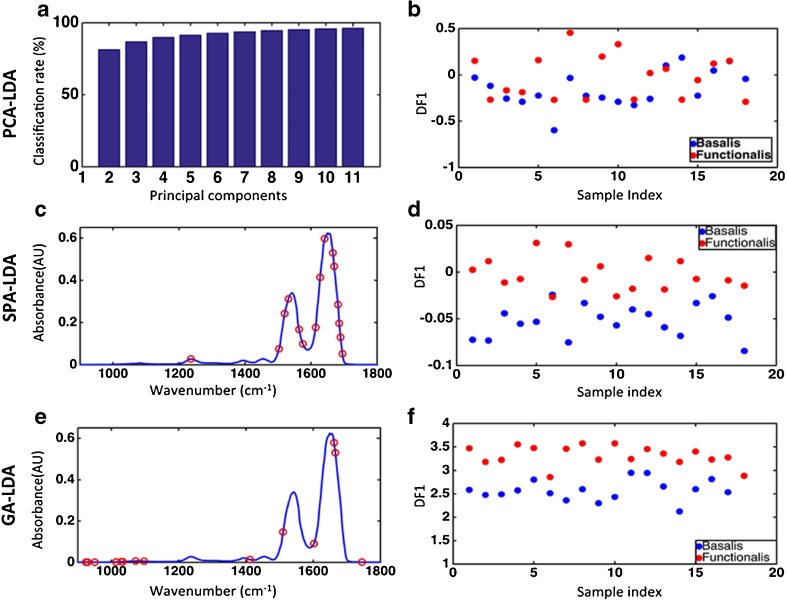
Fig. 3.
Classification of basalis and functionalis regions by spectral analysis using PCA-LDA, SPA-LDA and GA-LDA on FPA-FTIR derived data (red = functionalis, blue = basalis): All specimens. a Cost/function plot identifying the optimal number of PCs to be used for PCA. b Scores plot graphically representing classification by PCA-LDA. The x-axis represents the sample index and the y-axis the discriminant factor 1 (DF1). c Wavenumber selection for SPA-LDA. d Scores plot graphically representing classification by SPA-LDA. The x-axis represents the sample index and the y-axis DF1. e Wavenumber selection for GA-LDA. f Scores plot graphically representing classification by GA-LDA. The x-axis represents sample index and the y-axis DF1

