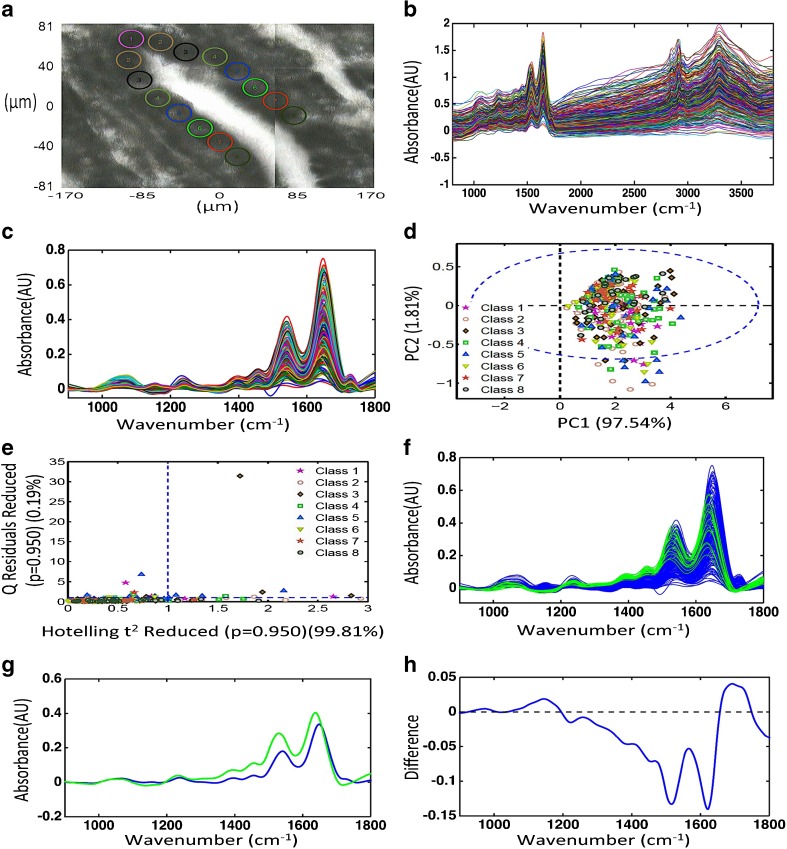
Fig. 6.
Exploratory analysis of synchrotron radiation-derived data from crypt bases to isolate putative stem cells and estimate their location. a Micrograph with circles representing the regions sampled (this is a representation as the regions analysed were selected at different magnifications to reveal the synchrotron radiation point spectral area). b Raw spectra of the classes (regions) sampled in crypt bases. c Pre-processed spectra of the classes (regions) sampled in crypt bases. d Scores plot graphically representing classification by PCA. The x-axis represents PC1 and the y-axis PC2, the dotted ellipse the 95 confidence interval (CI). e Scores plot graphically representing classification by Q residuals. The horizontal dotted line represents 2 standard deviations. f Pre-processed spectra of the epithelial cells (blue) and “outliers” (green) sampled in crypt bases. g Averaged spectra of the epithelial cells (blue) and “outliers” (green) sampled in crypt bases. h Loadings curve to identify wavenumbers responsible for segregation of “outliers” from other epithelial cells. The peaks and troughs furthest from the dotted line are the most responsible wavenumber regions

