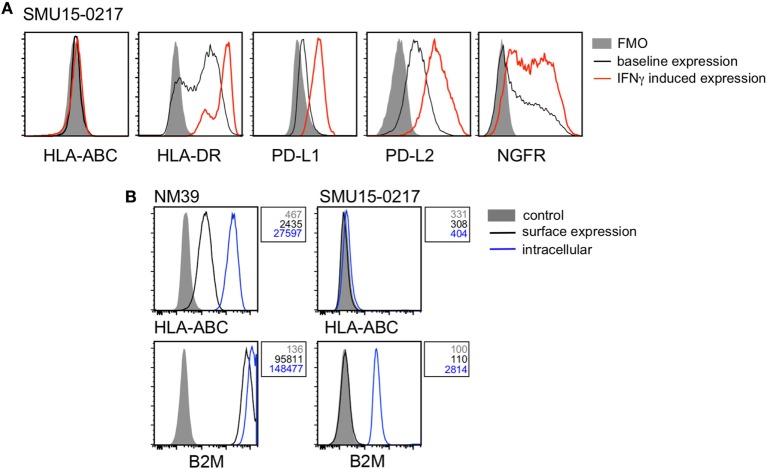
Figure 5.
Analysis of β-2-microglobulin (B2M) expression in the SMU15-0217 cell line. (A) Representative histograms of cell surface expression of HLA-ABC, HLA-DR, PD-L1, PD-L2, and nerve growth factor receptor (NGFR) on SMU15-0217 cells. Baseline expression is shown in black, interferon-γ (IFNγ)-induced expression in red, and fluorescence minus one (FMO) controls as shaded histograms. (B) Expression of HLA-ABC and B2M on the cell surface (black) and intracellularly (blue) in NM39 and SMU15-0217 cells. Shaded histograms represent the mock stained control and mean fluorescence intensity values are shown next to the histograms. NM39 cells were used as a positive control.

