Figure 6.
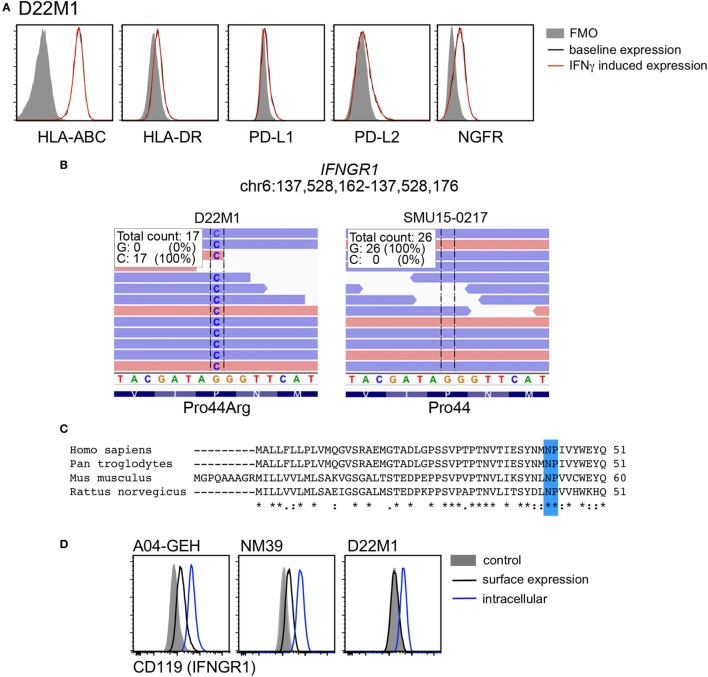
Analysis of interferon gamma receptor 1 (IFNGR1) expression in the D22M1 cell line. (A) Representative histograms of cell surface expression of HLA-ABC, HLA-DR, PD-L1, PD-L2, and nerve growth factor receptor (NGFR) on D22M1 cells. Baseline expression is shown in black, interferon-γ (IFNγ)-induced expression in red, and fluorescence minus one (FMO) controls as shaded histograms. (B) Whole exome sequencing analysis showing Pro44Arg (P44R) substitution in the D22M1 cell line but not in the SMU15-0217 cells. (C) Alignment of IFNGR1 protein sequence of human, chimpanzee, mouse, and rat (Clustal Omega) showing the highly conserved NP linker region highlighted in blue. (D) Expression of IFNGR1 on the cell surface (black) and intracellularly (blue) in A04-GEH, NM39, and D22M1 cells, with mean fluorescence intensity values also shown. Shaded histograms represent the mock stained control.

