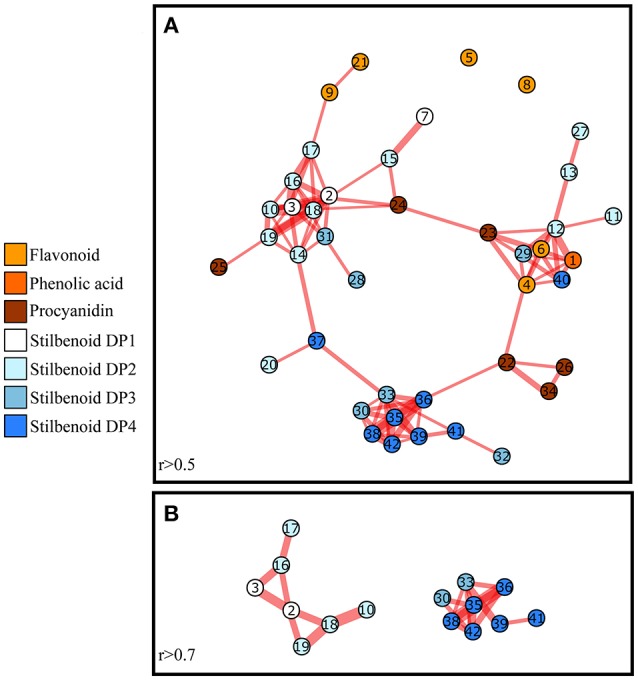
Figure 8.

Correlation-based networks of polyphenol metabolism related compounds in grape stems in 2013. Metabolite pairs whose correlation was significant with a minimum correlation coefficient of 0.5 (A) and 0.7 (B) are connected. Nodes represent metabolites and color refers to the class of polyphenols. Node numbers indicate the ID of the compounds as given in Table 2. Short node distance (Pearson correlation coefficients) and thick lines (P-values) indicate high correlation.
