Figure 3.
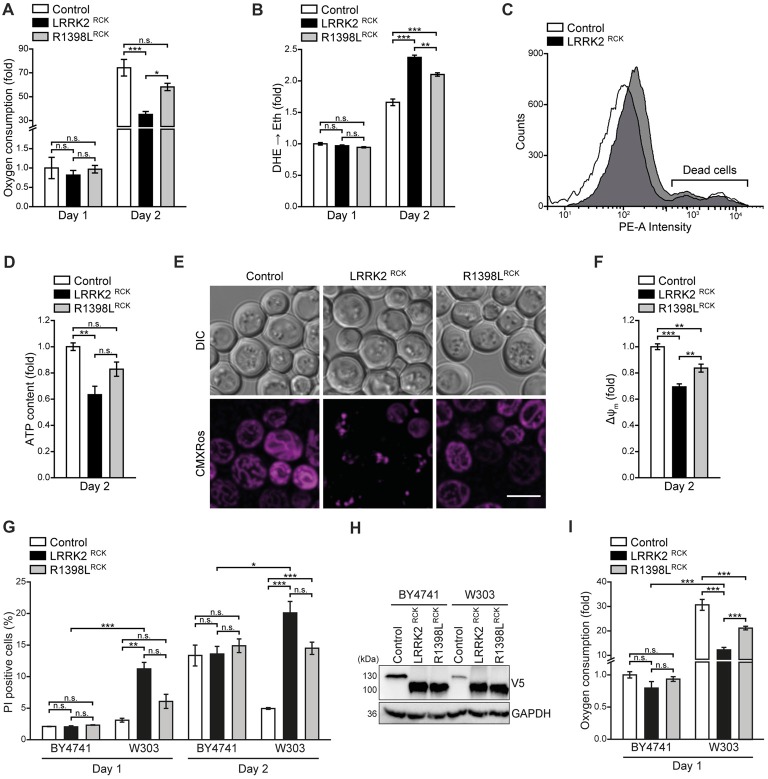
LRRK2RCK impairs mitochondrial function. (A) Oxygen consumption determined with a Fire-Sting optical oxygen sensor system in cells expressing LacZ, LRRK2RCK or R1398LRCK on day 1 and 2 of aging. Oxygen consumption was normalized to living cells and subsequently depicted as fold of control cells. Means ± SEM; n = 4. (B,C) Flow cytometric quantification of the reactive oxygen species (ROS)-driven conversion of non-fluorescent dihydroethidium (DHE) to fluorescent ethidium (Eth) in cells described in (A). Mean fluorescence intensities are shown as fold of control cells on day 1 (B). Dead cells, which accumulated Eth due to a loss of membrane integrity, were excluded from the analysis as shown in (C). Means ± SEM; n = 4. (D) Quantification of ATP content from cells described in (A) on day 2 of aging. Values were normalized to living cells and subsequently depicted as fold of control cells. Means ± SEM; n = 4. (E,F) Analysis of the mitochondrial transmembrane potential (ΔΨm) with Mitotracker CMXRos on day 2 of aging. Representative confocal micrographs (E) and flow cytometric quantification of the mean fluorescence intensity (F) are shown. Values for ΔΨm were normalized to control cells. Scale bar represents 5 μm. Means ± SEM; n = 4. (G) Flow cytometric quantification of loss of membrane integrity as indicated with PI staining of BY4741 and W303 strains expressing LacZ, LRRK2RCK or R1398LRCK on day 1 and day 2 of aging. Means ± SEM; n = 4. (H) Immunoblot analysis of protein extracts from cells as described in (G). Blots were probed with antibodies directed against the V5-epitope and against GAPDH as loading control. (I) Oxygen consumption determined with a Fire-Sting optical oxygen sensor system in cells as described in (G) on day 1 of aging experiments. Normalization was performed as described in (A). Means ± SEM; n = 4. ***p < 0.001, **p < 0.01, *p < 0.05, n.s. not significant.

