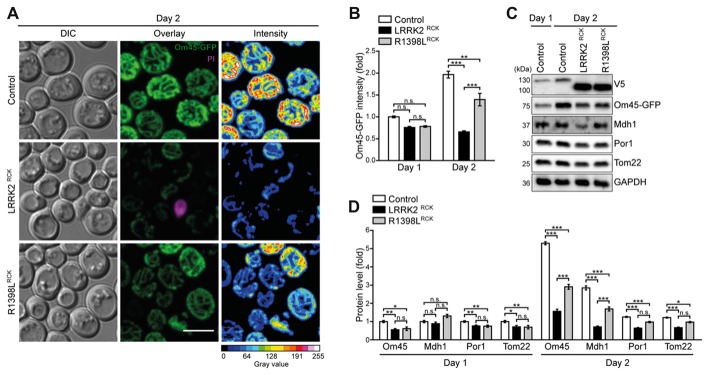
Figure 4.
Mitochondrial morphology and abundance is impaired by LRRK2RCK. (A,B) Analysis of cells harboring endogenously GFP-tagged Om45 expressing LacZ, LRRK2RCK or R1398LRCK. Representative confocal micrographs on day 2 (A) and flow cytometric quantification of Om45-GFP fluorescence signal at day 1 and 2 (B) are shown. Dead cells were excluded via PI counterstaining. Values were normalized to control cells on day 1. Scale bar represents 5 μm. Means ± SEM; n = 4. For confocal micrographs of Om45-GFP strains on day 1, please see Supplementary Figure S3A. (C,D) Immunoblot analysis of extracts from cells as described in (A). Representative immunoblots (C) and densitometric quantification (D) are shown. Blots were probed with antibodies directed against the V5- and the GFP-epitopes, against the mitochondrial proteins Mdh1, Por1 and Tom22, and against glyceraldehyde 3-phosphate dehydrogenase (GAPDH) as loading control. Values were normalized to the respective signals from control cells on day 1. Means ± SEM; n ≥ 6. For immunoblot analysis of Om45-GFP cells on day 1, and of Tim44-GFP strains, please see Supplementary Figures S3B–E. ***p < 0.001, **p < 0.01, *p < 0.05, n.s. not significant.

