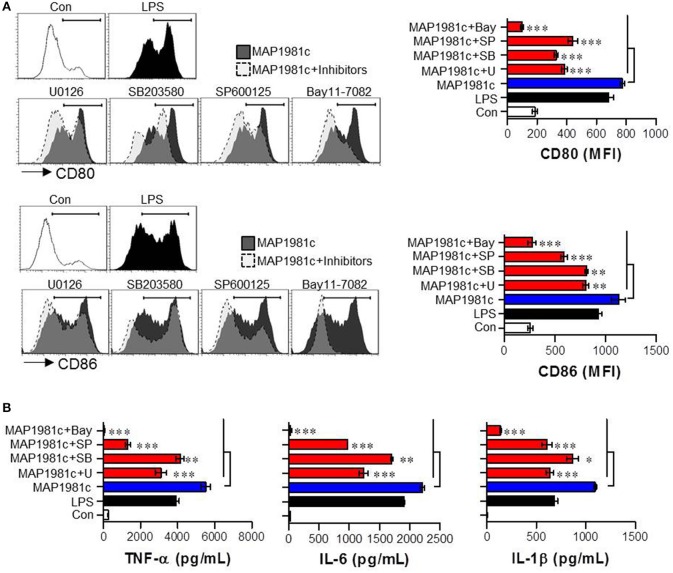
Figure 8.
Inhibition of MAP1981c-induced DC maturation via pharmacological inhibitors of MAPKs and NF-kB signals. Following pre-treatment with pharmacological inhibitors (ERK; U0126, JNK; SP600125, p38; SB203580, NF-kB; Bay11-7082) for 1 h, cells were stimulated with MAP1981c (5 μg/mL) for 24 h. (A, left panel) Analysis of surface markers (CD80 and CD86) on stimulated CD11c+ DCs by using flow cytometry. The histograms shown are representative of three independent experiments. (A, right panel) The MFI calculated from histograms is indicated as the mean ± SD of three independent experiments. **p < 0.01, ***p < 0.001 for the treatments compared with MAP1981c-treated DCs (MAP1981c). (B) The culture supernatants were analyzed for the amounts of TNF-α, IL-6, and IL-1β by using ELISA. *p < 0.05, **p < 0.01, ***p < 0.001 for the treatments compared with MAP1981c-treated DCs (MAP1981c). U; U0126, SP; SP600125, SB; SB203580, Bay; Bay11-7082.

