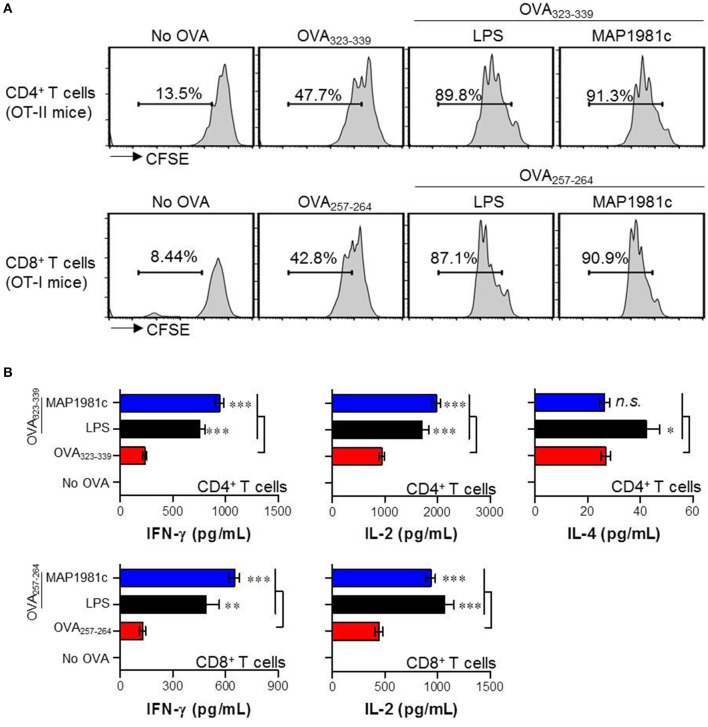
Figure 9.
Proliferation and cytokine production of T cells induced by MAP1981c-treated DCs. (A,B) DCs were treated with MAP1981c (5 μg/mL) or LPS (100 ng/mL). After 24 h treatment, cells were stimulated with OVA323−339 or OVA257−264 of 1 μg/mL concentration for 1 h and then co-cultured with CFSE-labeled OVA-specific CD4+ and CD8 T cells. (A) After 3 days co-culture, cells were harvested and stained with anti-CD4 or CD8 Abs and then T cell proliferations were analyzed by flow cytometry. The histograms shown are representative of three independent experiments. (B) The culture supernatants were analyzed for the amounts of IFN-γ, IL-2, and IL-4 by using ELISA. All bar graphs show the means ± SD of 3 samples. One representative plot out of three independent experiments is shown; *p < 0.05, **p < 0.01, ***p < 0.001 for the treatments compared with OVA-treated DCs (OVA323−339-treated DCs or OVA257−264-treated DCs).

