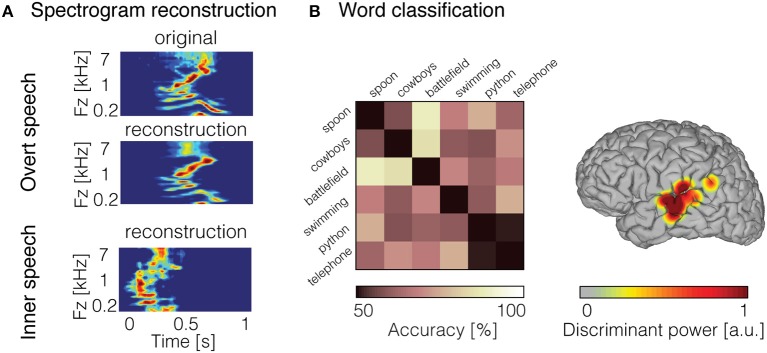
Figure 3.
Decoded inner speech representation. (A) Examples of overt speech and inner speech spectrogram reconstruction using linear regression models. Original spectrogram of the recorded overt speech sound is displayed (top panel). Reconstruction of the spectrogram for the overt speech condition (middle panel) and inner speech condition (bottom panel). (B) Examples of word pair classification during inner speech (left panel). Chance level was 50% (diagonal elements), whereas pairwise classification accuracy (off-diagonal elements) reached 88% and was significantly above chancel level across the 15 pairs of word (mean = 69%). Discriminant information displayed on the surface reconstruction of the participant's brain (right panel) for the classification accuracy shown in the left panel. Figures adapted from Martin et al. (2014, 2016) with permissions.

