
FIGURE 2.
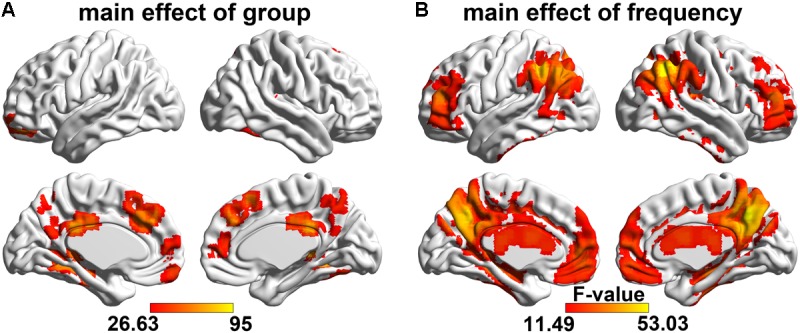
Main effect of the group and frequency factors on ALFF. The regions showing the spatial distribution of the significant (A) group main effect and (B) frequency main effect (F-test, voxel size > 20, p < 0.05, FWE corrected). The hot color represents the greater main effect of the factors on the ALFF.