
FIGURE 6.
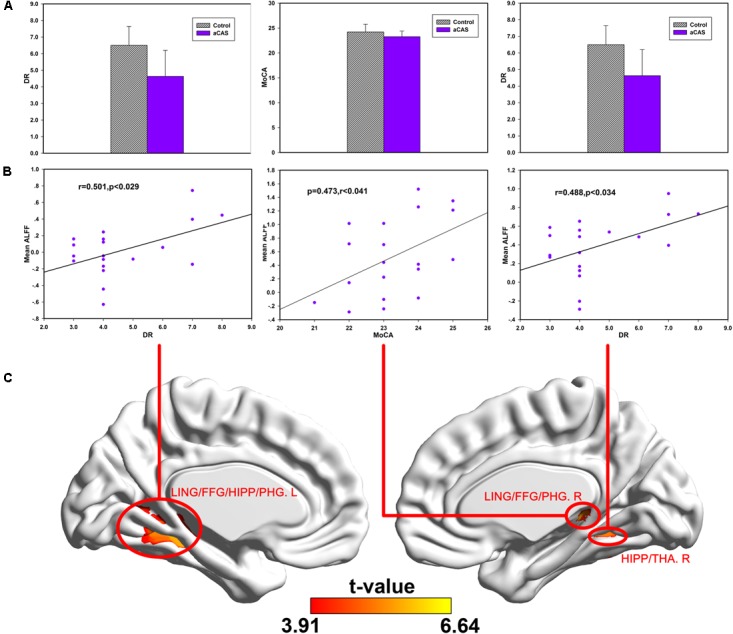
Correlations between cognitive test scores and ALFF changes in the regions with significant between group difference in Slow-4 band. (A) The bar maps show DR and MoCA scores between two groups. (B) The scatters maps and its regressions show the distribution and their significant correlation between mean ALFF in (C) brain regions and cognitive test score (MoCA and DR), respectively.