
FIGURE 2.
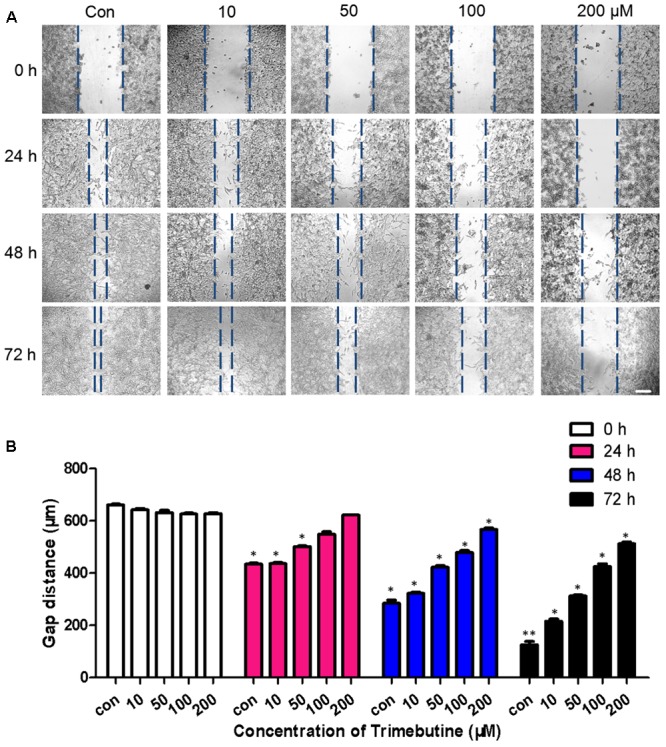
Trimebutine suppresses U-87 MG cell migration in a wound healing assay. (A) Representative images captured under a phase contrast microscope after 24, 48, and 72 h of treatment with various concentrations of trimebutine. The vertical lines indicate the wound edge. Scale bar, 200 μm. (B) The gap distance was measured with Image J, and the average gap distances are shown. The data are presented as the means ± SEM for 4 independent experiments. ∗P < 0.05 and ∗∗P < 0.01 vs. vehicle control group (one-way ANOVA with Tukey’s post hoc test).