
Fig. 1.
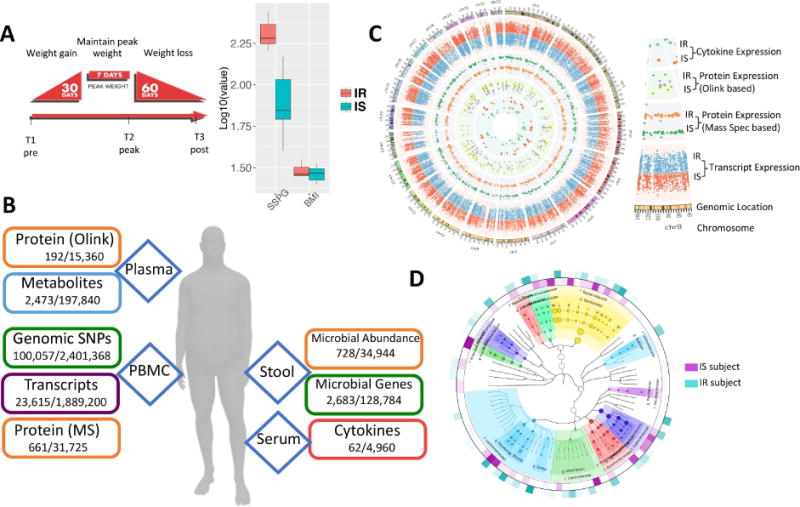
Overview of the multi-omic weight perturbation experiment. (A) Schematic of the weight gain and loss perturbation. The sampling timepoints (T1–T3) are indicated at the specific time in the perturbation when they occur. Inset: SSPG and BMI measurements for IS and IR subjects. (B) The types of ‘omics analyses performed are indicated along with the types of biological materials they are performed on. Listed below each data type are the number of analytes measured per timepoint for each individual, as well as the total number of analytes measured across the study. (C) Circos plot of multi-omic data points from selected assays. The transcriptome, both targeted and untargeted proteome and serum cytokine levels are plotted according to their genomic location as well as the average expression in IR and IS participants (see inset labels). (D) The stool microbiome phylogenetic tree is visualized by GraPhlAn for taxonomies present across all participants along with the respective relative abundance in IR and IS (outer layers).