
Fig. 2.
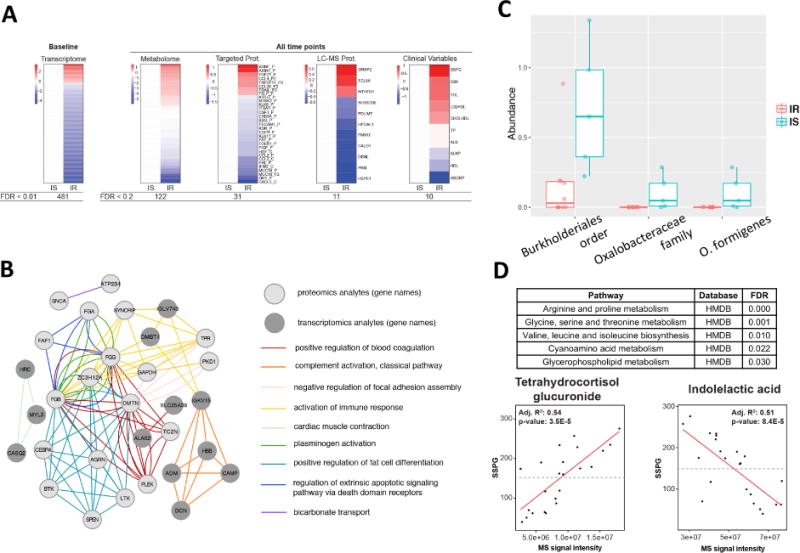
Differences between IR and IS participants at baseline. (A) Heatmap showing differences between IR and IS in baseline molecular abundance for each ‘omic type. Each analyte is normalized according to the average expression in IS and significant differences in the IR group are plotted (red=upregulated in IR, blue=downregulated in IR). (B) Pathways exhibiting significant transcriptomic and proteomics differences between IR and IS. The top Gene Ontology categories are presented and top transcripts and proteins are plotted in a network diagram showing pathway connections. (C) Differences in microbial abundance (%) between IR and IS by both 16S and shotgun metagenomic sequencing. (D) Regression analysis detailing association of multiple metabolites with clinical steady-state-plasma glucose (SSPG). MS signal intensity is plotted versus SSPG (mg/dl) for the selected metabolites indolelactic acid and tetrahydrocortisol glucuronide. Inset are the R2 and p-values for the selected comparisons.