
Fig. 3.
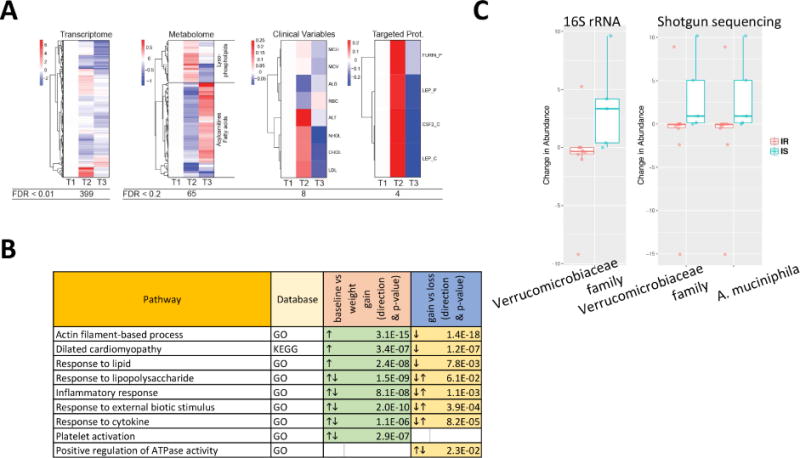
Multi-omic differences over the course of weight gain and loss perturbation experiment. (A) Heatmap showing analytes that vary in abundance in response to the weight gain and loss perturbation. (B) Pathways that are significantly different between baseline versus weight gain, and weight gain versus weight loss, respectively. (C) IR or IS-specific microbiome changes are shown for selected taxonomic units confirmed by both methods (16S and shotgun metagenomics).