
Fig. 4.
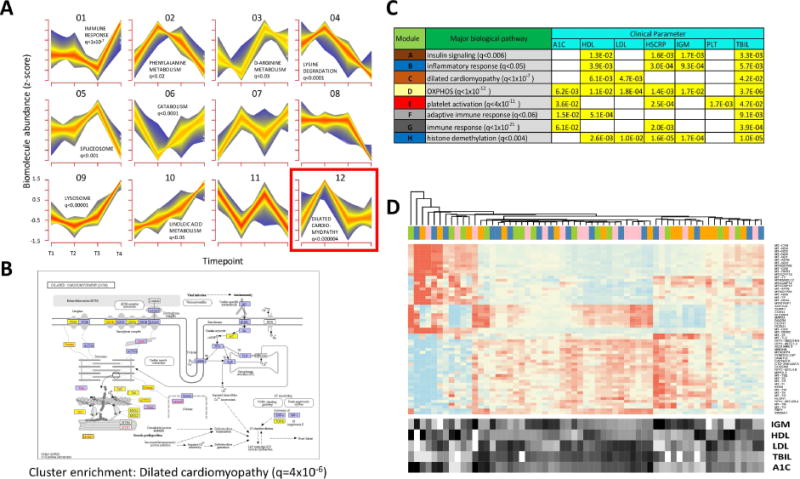
Multiparametric and trend analyses reveal novel responses to weight gain and loss. (A) Longitudinal pattern recognition using fuzzy c-means clustering across all host ‘omes. Data from the transcriptome, proteome, cytokines and metabolites were standardized to z-scores for each analyte and subjected to c-means clustering across all four timepoints. Each subplot shows a unique cluster and the trend for all analytes comprising the cluster. (B) KEGG pathway diagram for analytes implicated in dilated cardiomyopathy, a pathway that was significantly enriched in Cluster 12 (FDR < 0.000004). Elements highlighted in yellow indicate the pathway analytes that comprise Cluster 12. (C) Table showing biological pathway enrichment and association with clinical blood panel analytes for key gene co-expression clusters. (D) Gene expression heatmap for transcripts comprising the yellow module from Fig. S3. The expression for each gene is shown for all timepoints (T1, pink; T2, blue; T3, orange; T4, green.) along with the relative levels for each of the enriched clinical parameters (A1C, LDL, HDL, IGM and bilirubin (TBIL)).