
Fig. 5. Associations of analytes across IR and IS and across ‘omes.
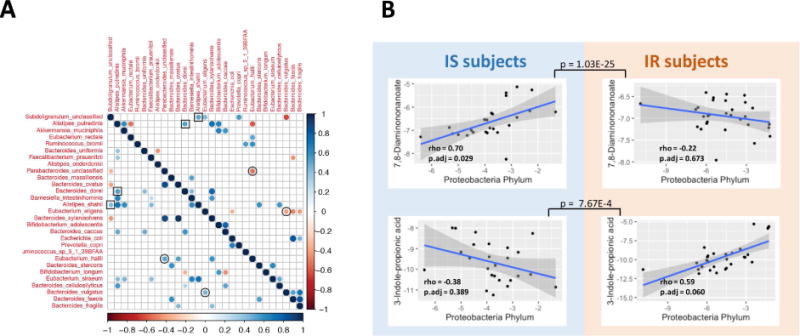
(A) Co-varying microbial species are plotted based on whether they are co- or inversely associated (blue or red, respectively), and whether this occurs in IR (upper quadrant) or IS (lower quadrant). (B) Co-variation of microbes and metabolites for IR and IS is plotted for selected associations. Inset are the Spearman’s rho and adjusted p-values after FDR correction for the selected associations. Also, adjusted p values by FDR are shown between IS and IR individuals for the interaction term of linear model describing different trends in two groups.