
Fig. 6. Personal variation of ‘omics data.
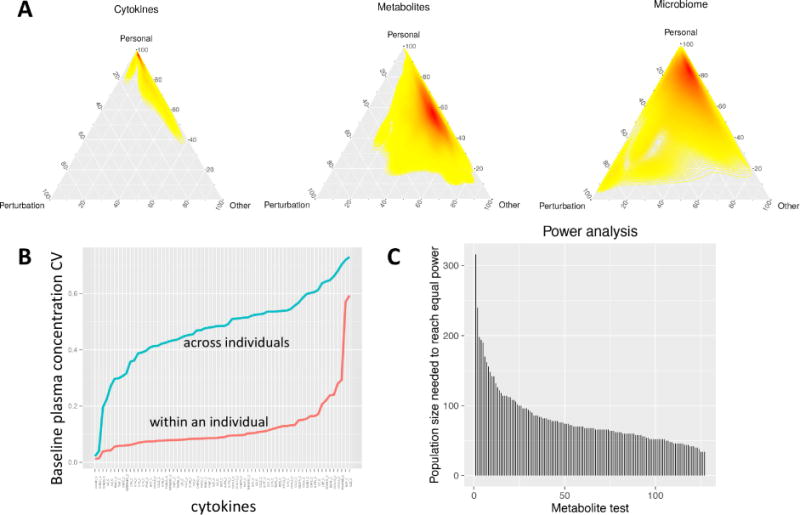
(A) Variance decomposition analysis of selected ‘omes (see Fig. S9 for others). The variance across all timepoints was deconvolved into experiment-dependent variation (i.e. due to the perturbation), personal variation (within an individual), or other types of variation (technical or unknown sources). The heatmap color (yellow to red) indicates the density of analytes at each particular coordinate. (B) Variation in cytokine/chemokine/adipokine abundance within participants versus across participants. The coefficient of variation for all measured Luminex immunoassays is plotted for across steady-state timepoints (T1 and T4) within an individual (red) and across individuals (blue). (C) Power comparison for longitudinal versus group wise study designs using metabolomics data as an example.