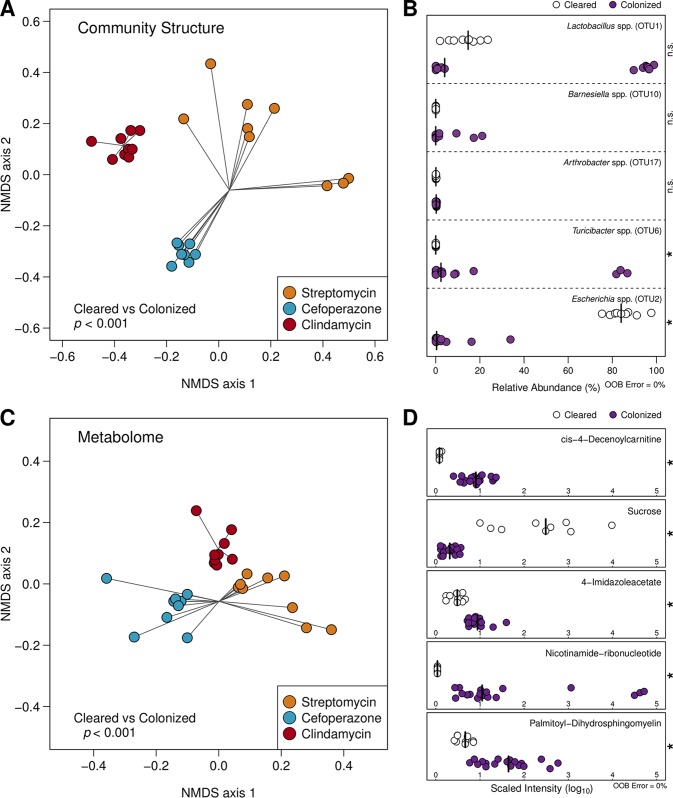
FIG 2 .
Significant differences in cecal community structure and metabolomes track with downstream C. difficile clearance across antibiotic pretreatment regimens. (A) Nonmetric multidimensional scaling (NMDS) ordination of Bray-Curtis distances of OTU relative abundances between mouse cecal communities that remained colonized by C. difficile and those that eventually cleared the infection. (B) Relative abundance of OTUs included the optimal model generated by AUCRF classifying the same groups as in panel A. Species-level identification was obtained using centroid representative sequences for each OTU. (C) NMDS ordination of Bray-Curtis distances using metabolite intensities between the abovementioned groups of animals. (D) Scaled intensity of metabolites included the optimal model generated by AUCRF classifying colonized and clearing mouse cecal microbiomes. Differences for ordinations in panels A and C were calculated using PERMANOVA. Optimal AUCRF models demonstrated 0% out-of-bag (OOB) error, and significant differences in panels B and D were determined by Wilcoxon rank sum test with Benjamini-Hochberg correction.

