Fig. 4.
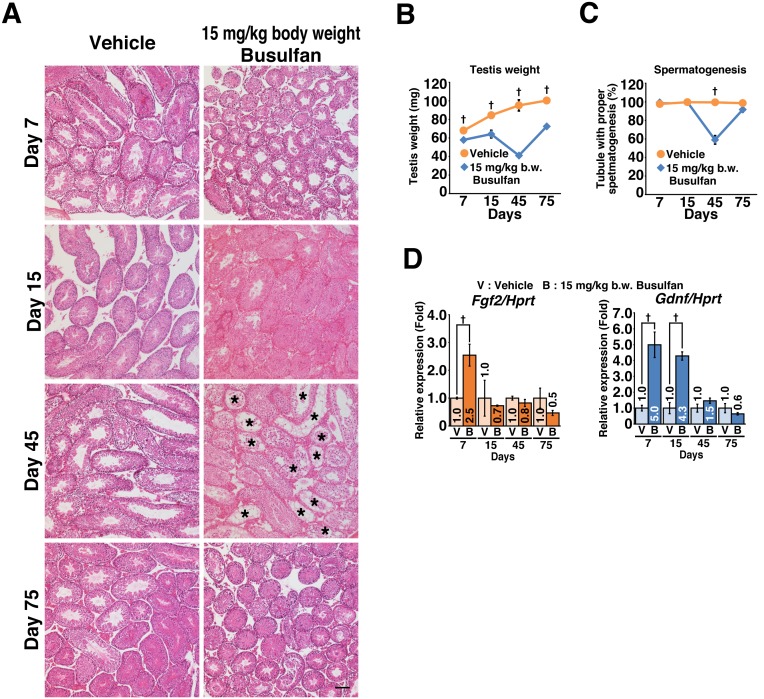
Expression dynamics of Fgf2 and Gdnf during testicular regeneration. Mice testes treated with 15 mg/kg body weight busulfan at 6 weeks of age were analyzed at the indicated time points. (A) Histological changes induced by busulfan treatment (n = 3 for each group). Asterisks (*) indicate tubules with spermatogenic arrest. (B) Testis weight (n = 3 for each group). (C) Spermatogenic arrest caused by busulfan treatment. The proportion of tubules with active spermatogenesis was evaluated (n = 3 for each group). The total numbers of tubules counted were 1130 and 1245 for vehicle- and busulfan-treated testes, respectively. (D) Expression of Fgf2 and Gdnf during testicular regeneration. After normalization to Hprt expression, the value of the vehicle (V) control group at each time point was set to 1.0 (n = 3 for each group); B, busulfan. Results are shown as the mean ± SEM. Bar = 100 μm (A). Daggers (†) indicate statistically significant differences between treatment groups (P < 0.05).

