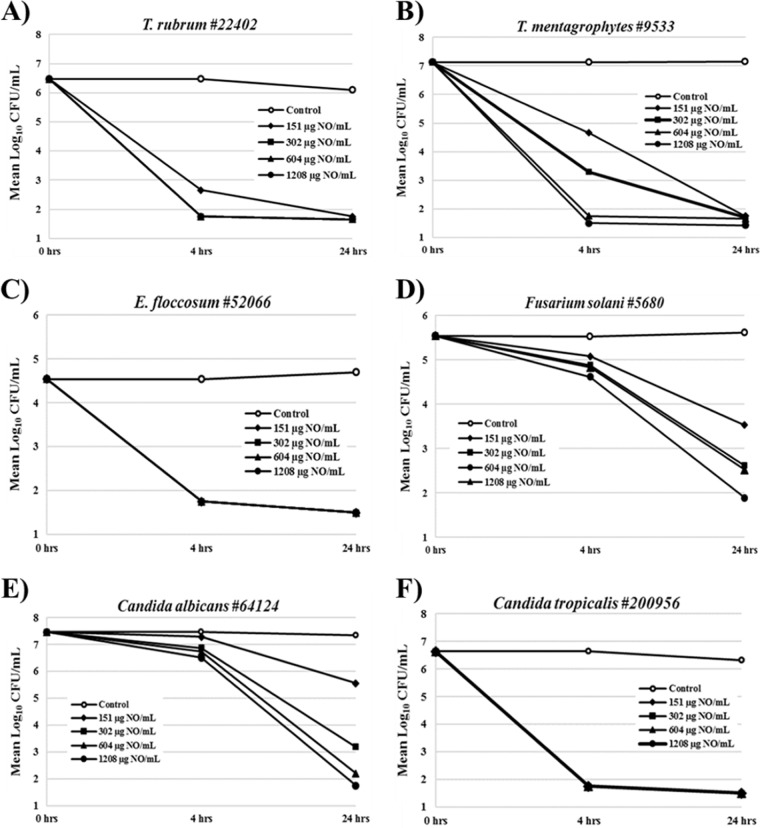
FIG 2.
Time-kill curves for representative fungal isolates following exposures to NVN1000 from 4 to 24 h. Reported values are the means of two independent assays and are reported as the mean log CFU/ml at the designated time point. Open circles, untreated control; closed symbols, various concentrations of NVN1000.

