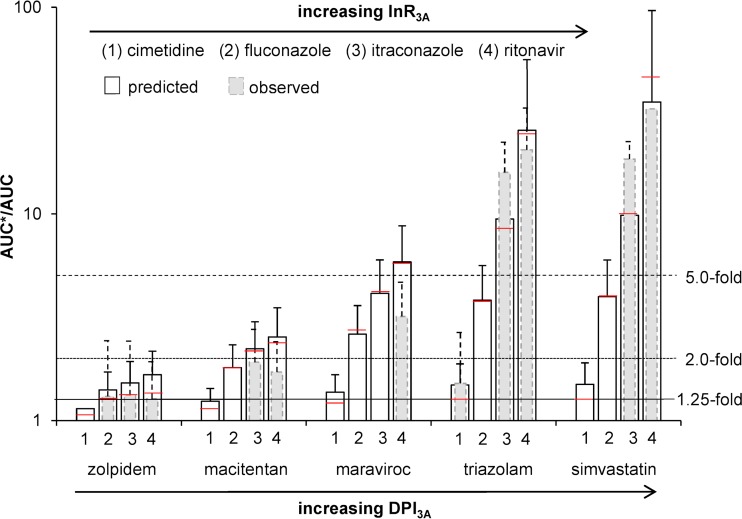
FIG 2.
Comparison of predicted (white bars) and observed (gray bars) AUC ratios plus standard deviations for the five victim drugs zolpidem (DPI3A, 0.303 [0.065, 0.661]), macitentan (DPI3A, 0.524 [0.200, 0.810]), maraviroc (DPI3A, 0.792 [0.559, 0.998]), triazolam (DPI3A, 0.966 [0.898, 1.0]), and simvastatin (DPI3A, 0.979 [0.916, 1.0]), administered together with the four CYP3A inhibitors cimetidine (InR3A, 0.256 [0.049, 0.570]), fluconazole (InR3A, 0.700 [0.403, 0.893]), itraconazole (InR3A, 0.877 [0.691, 0.986]), and ritonavir (InR3A, 0.963 [0.873, 1.0]). The red line represents the calculated value without using Monte Carlo predictions. The solid line, the dotted line, and the dashed line represent the 1.25-fold, 2.0-fold, and 5.0-fold increases in the AUC ratio according to the FDA classification of DDI magnitudes (29).

